Extracted images: Groundwater Table Hydraulic Impact Assessments for Infiltration BMPs
Printed revision: March 2020.
Back to source | Original PDF | Image metadata
Original Mistral crops are preserved byte for byte. A crop can be a figure, table, equation, or other visual; no visual content is inferred as a numerical rule. Record and table associations use the same PDF page unless a direct image placeholder is identified. Nearby OCR excerpts are context, not verified captions.
PDF page 1, image 1
Mistral ID: img-0.jpeg. Extraction bundle(s): 2023_BMP_13_Groundwater_Mounding_Analysis. Original page | Image file
Surrounding OCR excerpt:
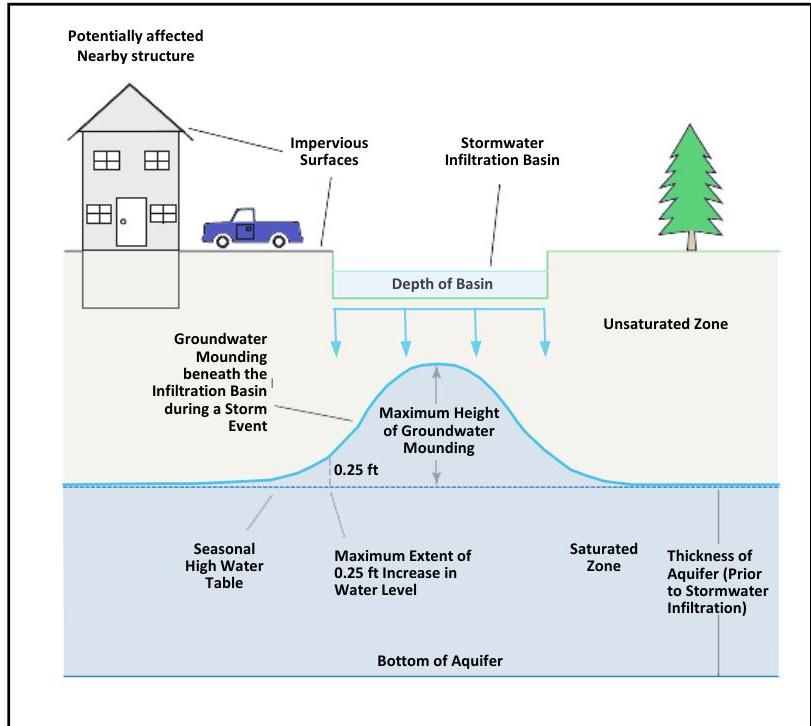
ta located below the root zone of the vegetation on site and above the groundwater table in the area directly below a stormwater recharge BMP, as shown in the image below.

## Basics of Groundwater Mounding

[OCR image]

Source: Carleton, Glen B. 2010. Simulation of Groundwater Mounding Beneath Hypothetical Stormwater Infiltration Basins, Scientific Investigations Report 2010-5102. U.S. Department of the Interior. U.S. Geological Survey. Reston, VA.

This mounding process is transient in that infiltrating runoff builds up in the unsaturated zone as stormwater infiltrates or recharges and then gradually spreads out to t
PDF page 3, image 1
Mistral ID: img-1.jpeg. Extraction bundle(s): 2023_BMP_13_Groundwater_Mounding_Analysis. Original page | Image file
Surrounding OCR excerpt:
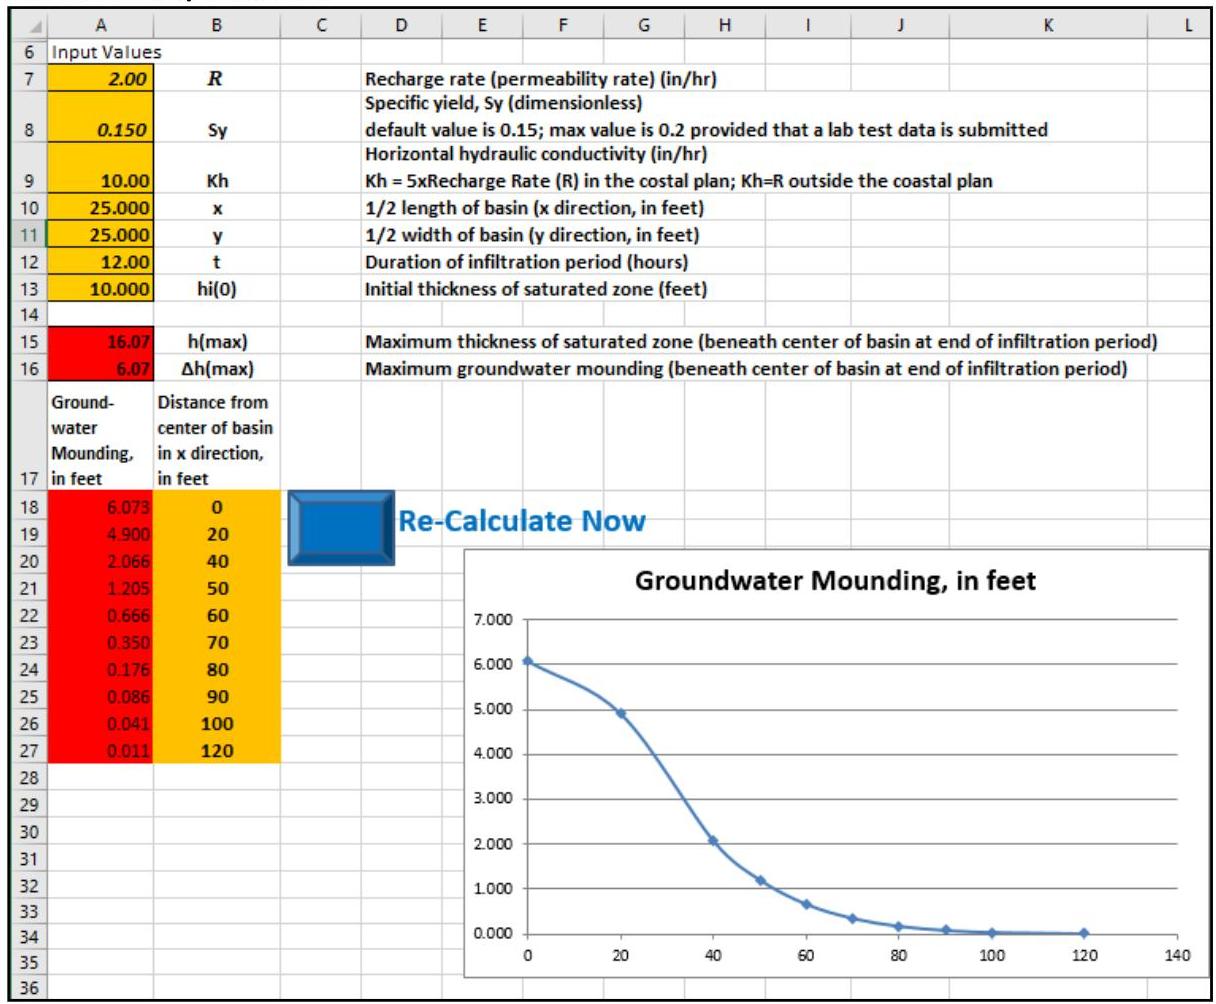
use the results of the Hantush Spreadsheet to evaluate whether the maximum height of the groundwater mounding,  $\Delta h(\max)$ , which is found in cell A16, will reach the bottom of the infiltration BMP.

[OCR image]
The Hantush Spreadsheet

Beginning on the following page is a description of the various input parameters in the Hantush Spreadsheet and default values and/or appropriate ranges for those parameters are provided. Some input parameters, such as the basin dimensions, are based solely on the proposed design and a range of values is not given. Since the spreadsheet can quickly calculate results, the most ap
PDF page 6, image 1
Mistral ID: img-2.jpeg. Extraction bundle(s): 2023_BMP_13_Groundwater_Mounding_Analysis. Original page | Image file
Surrounding OCR excerpt:
[OCR image]

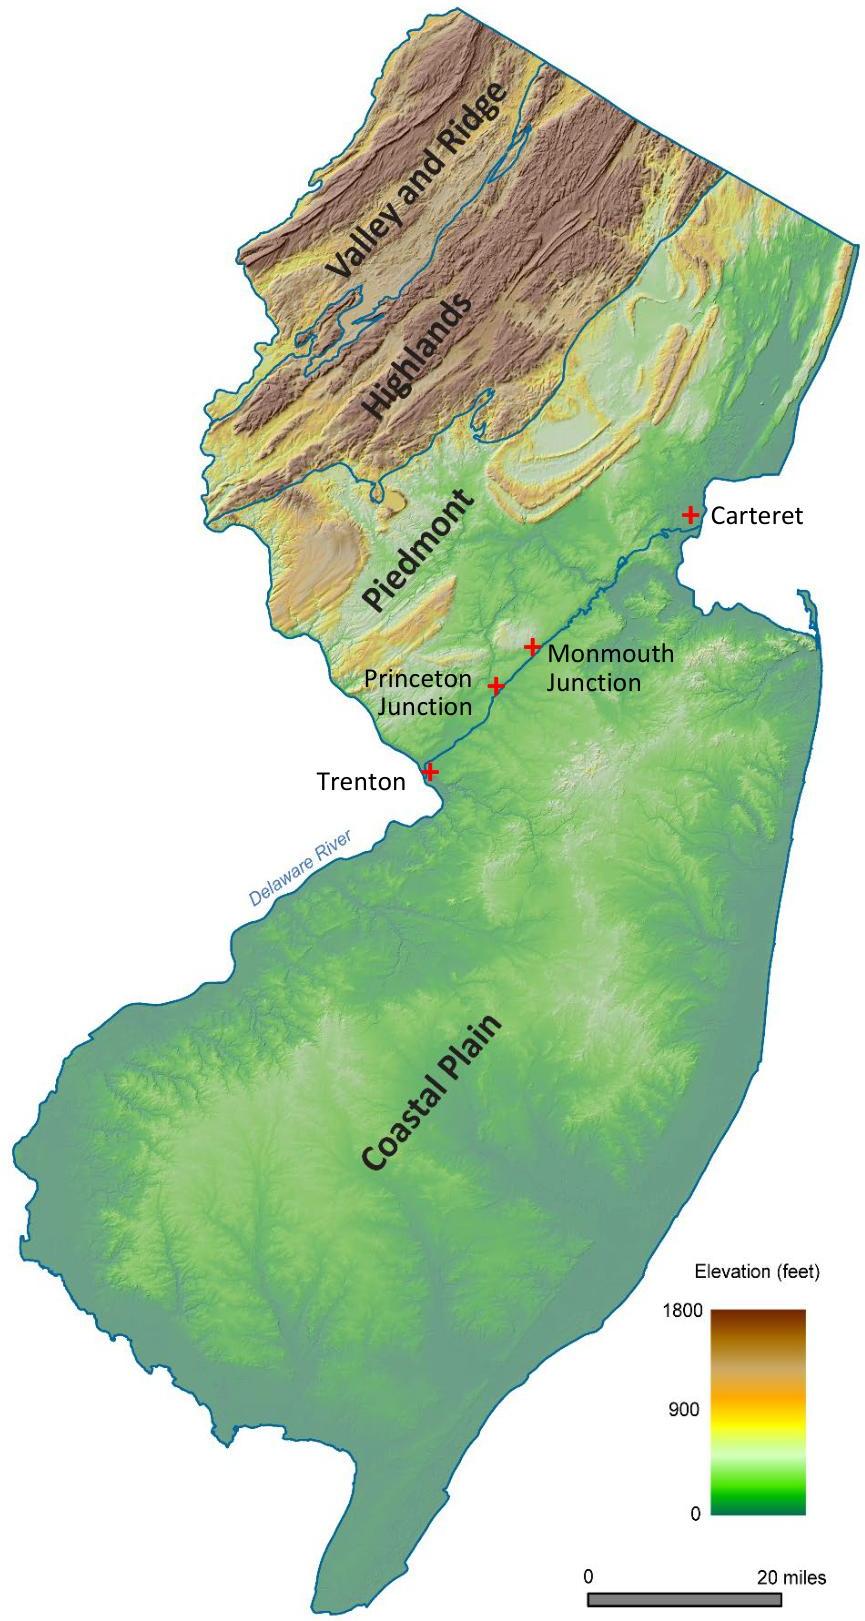
Imagery modified from New Jersey Geological Survey Information Circular, "Physiographic Provinces of New Jersey," 2006 and used with permission
PDF page 21, image 1
Mistral ID: img-3.jpeg. Extraction bundle(s): 2023_BMP_13_Groundwater_Mounding_Analysis. Original page | Image file
Surrounding OCR excerpt:
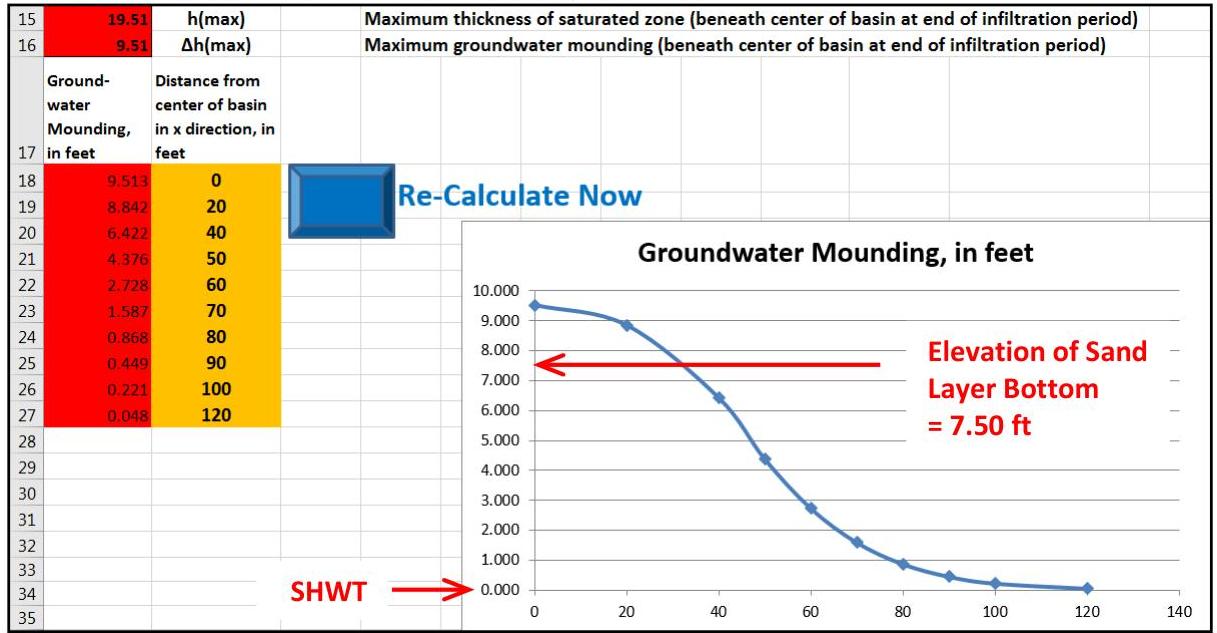
rsects and exceeds the elevation of the bottom of the sand layer, interfering with the infiltration capability. Adjustments of the spreadsheet inputs are needed to reduce the height of groundwater mounding.

[OCR image]

## Step 3: Adjust spreadsheet inputs

The height of groundwater mounding determined in Step 2 will reduce the vertical hydraulic gradient, which then slows the infiltration of runoff. Therefore, the vertical hydraulic conductivity will not be as high as expected, meaning it must be adjusted and rechecked to determine if the basin can still drain within 72 hours. For this example, the recharge rate is r
PDF page 23, image 1
Mistral ID: img-4.jpeg. Extraction bundle(s): 2023_BMP_13_Groundwater_Mounding_Analysis. Original page | Image file
Tables on the same PDF page: Table 24
Surrounding OCR excerpt:
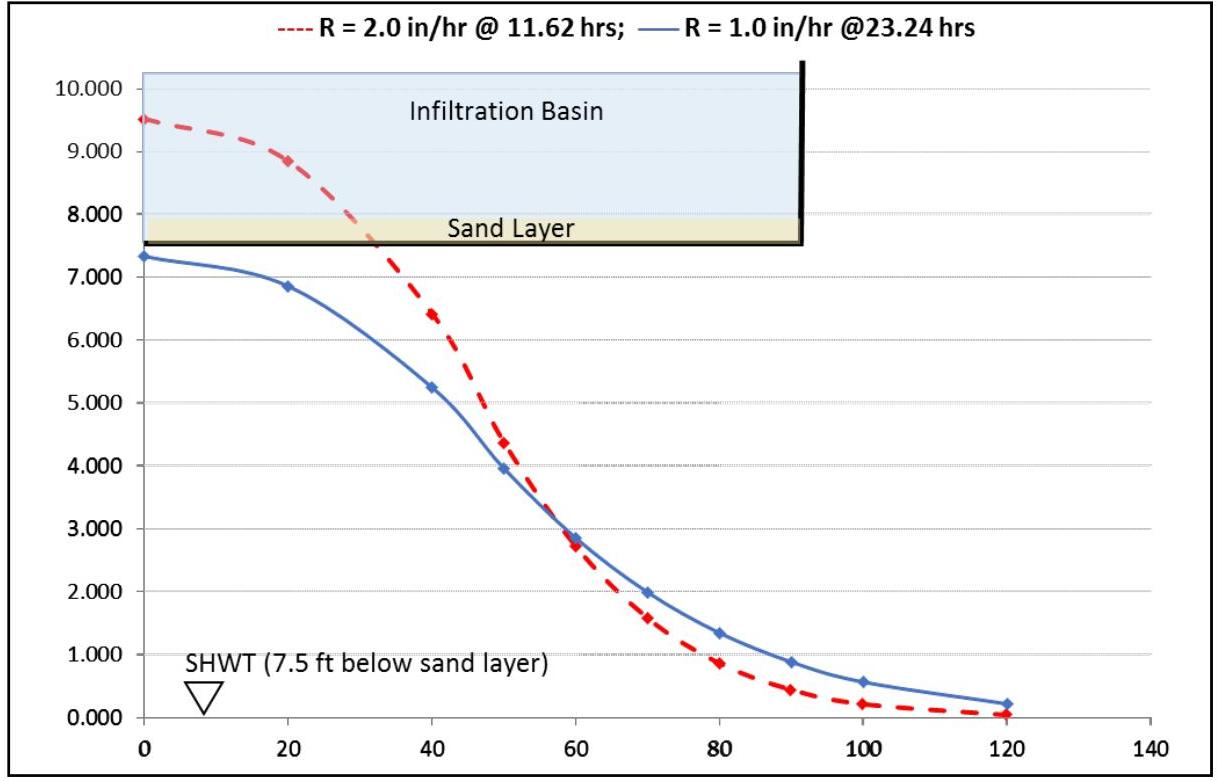
ssuming a recharge rate of 2 in/hr and infiltrating the runoff in 11.62 hr. The blue solid line represents the infiltration basin assuming a recharge rate of 1 in/hr and infiltrating the runoff in 23.24 hr.

[OCR image]
Example 2: A Comparison of Mounding Effects Caused by Different Recharge Rates
PDF page 27, image 1
Mistral ID: img-5.jpeg. Extraction bundle(s): 2023_BMP_13_Groundwater_Mounding_Analysis. Original page | Image file
Tables on the same PDF page: Table 28
Surrounding OCR excerpt:
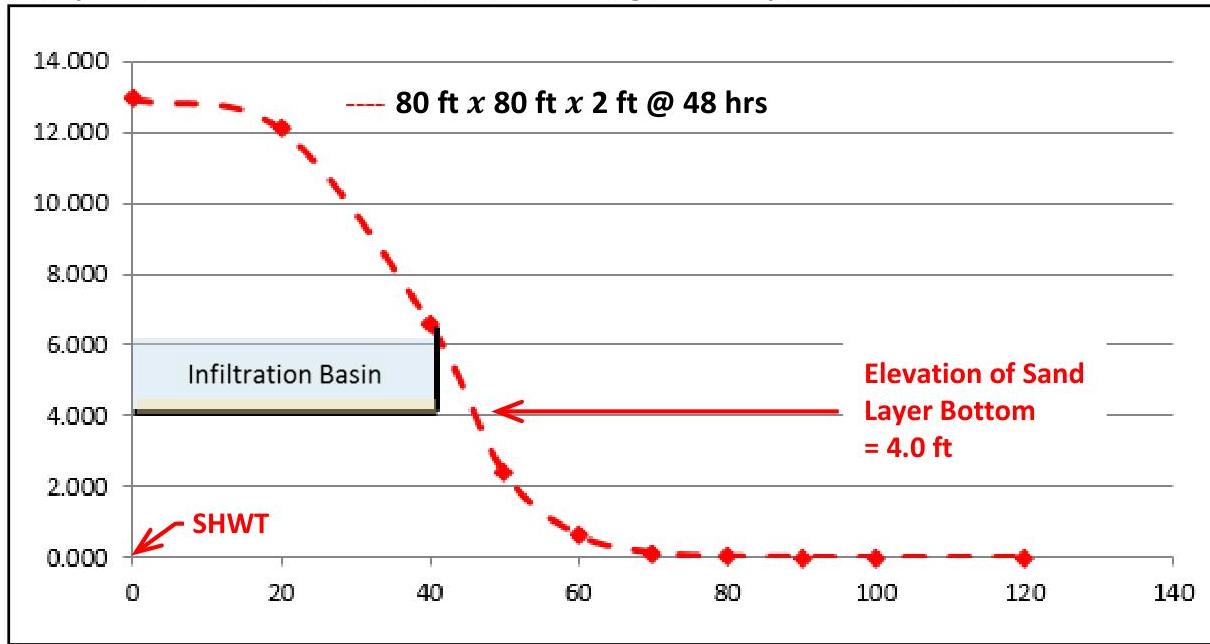
ltrate in too small of an area produces an excessive height of groundwater mounding, which is depicted as the dashed red line.

Example 3: Estimation of Groundwater Mounding Caused by a Too-small Basin Size

[OCR image]

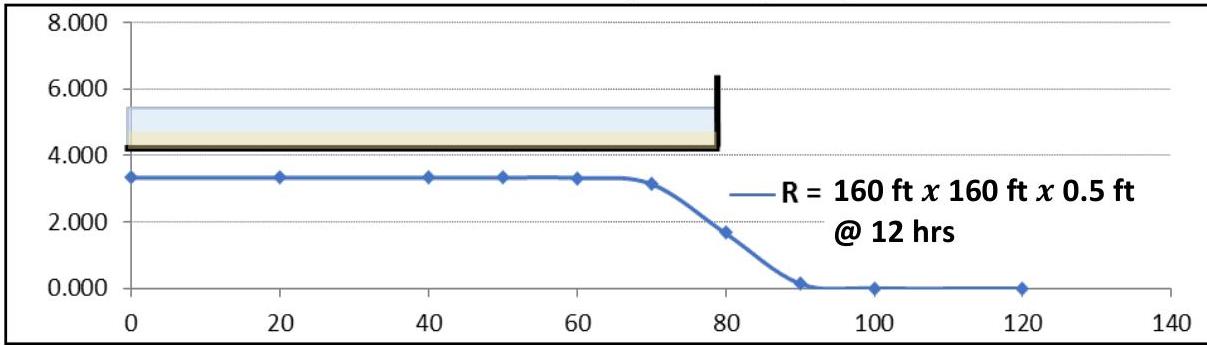
The figure at the top of the following page depicts a basin having a shallower depth, i.e., 0.5 ft, of stormwater runoff to be infiltrated than the one above and a  $400\%$  larger infiltration area over which to distribute the same volume of runoff. The groundwater table, depicted as a blue line, temporarily rises but does not reach to the basin bottom. Therefore, the basin can infiltrate the runoff a
PDF page 28, image 1
Mistral ID: img-6.jpeg. Extraction bundle(s): 2023_BMP_13_Groundwater_Mounding_Analysis. Original page | Image file
Tables on the same PDF page: Table 29
Surrounding OCR excerpt:
[OCR image]
Example 3: Estimation of Groundwater Mounding Caused by a Larger Basin Size

# Notes on Making Adjustments to the Design of a BMP

The adjustment of the design of a BMP to avoid the intrusion of groundwater mounding into the bottom area may require several iterations involving different footprint sizes, maximum depths of stormwater runoff to be infiltrated, and durations of infiltration periods. A quick
PDF page 29, image 1
Mistral ID: img-7.jpeg. Extraction bundle(s): 2023_BMP_13_Groundwater_Mounding_Analysis. Original page | Image file
Surrounding OCR excerpt:
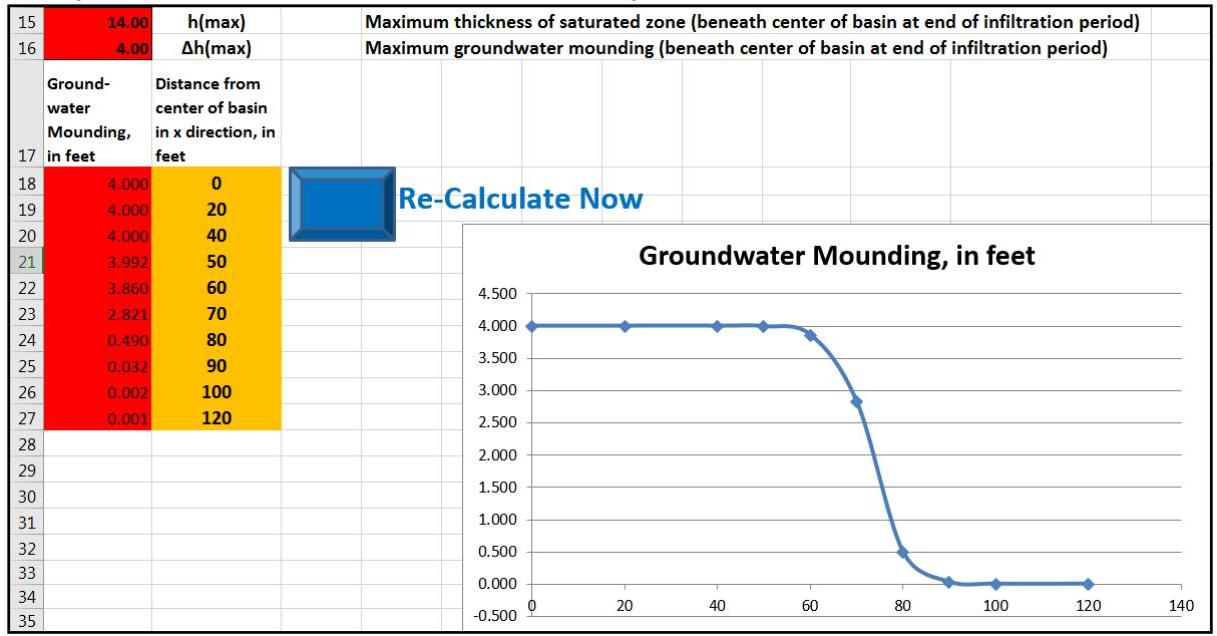
The results, depicted below, show that the mounding height is 4 ft, which just reaches the bottom of the basin:

[OCR image]
Example 3: New Results Section of the Hantush Spreadsheet

The initial estimate of basin size, 147 ft x 147 ft x 0.6 ft, is close to the redesigned basin size of 160 ft x 160 ft x 0.5 ft. Since this is an initial estimate, more iterations of the analysis, using a larger basin with shallower depth of stormwater runoff to be infiltrated, may be desired.

# Example 4: Rectangular or round infiltration BMP
PDF page 31, image 1
Mistral ID: img-8.jpeg. Extraction bundle(s): 2023_BMP_13_Groundwater_Mounding_Analysis. Original page | Image file
Surrounding OCR excerpt:
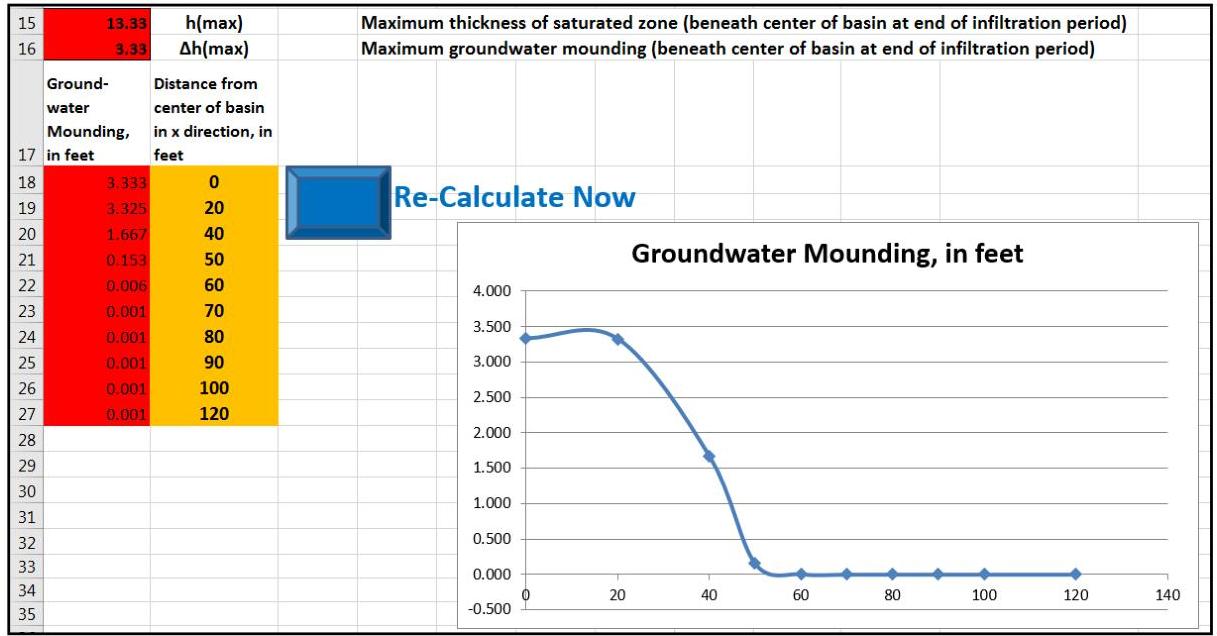
The results show the extent of the mounding along the short side of the rectangular basin:

[OCR image]
Example 4: Results Section of the Hantush Spreadsheet – Short Side Evaluation

The results show that the maximum mounding height at the center of the basin remains same as that of the square basin from Step 3 of Example 3. However, the extents of the mounding curves along long side and the short side of a rectangular basin are different.

# Example 5: Underground perforated pipe scenario

A site is loca
PDF page 33, image 1
Mistral ID: img-9.jpeg. Extraction bundle(s): 2023_BMP_13_Groundwater_Mounding_Analysis. Original page | Image file
Surrounding OCR excerpt:
[OCR image]
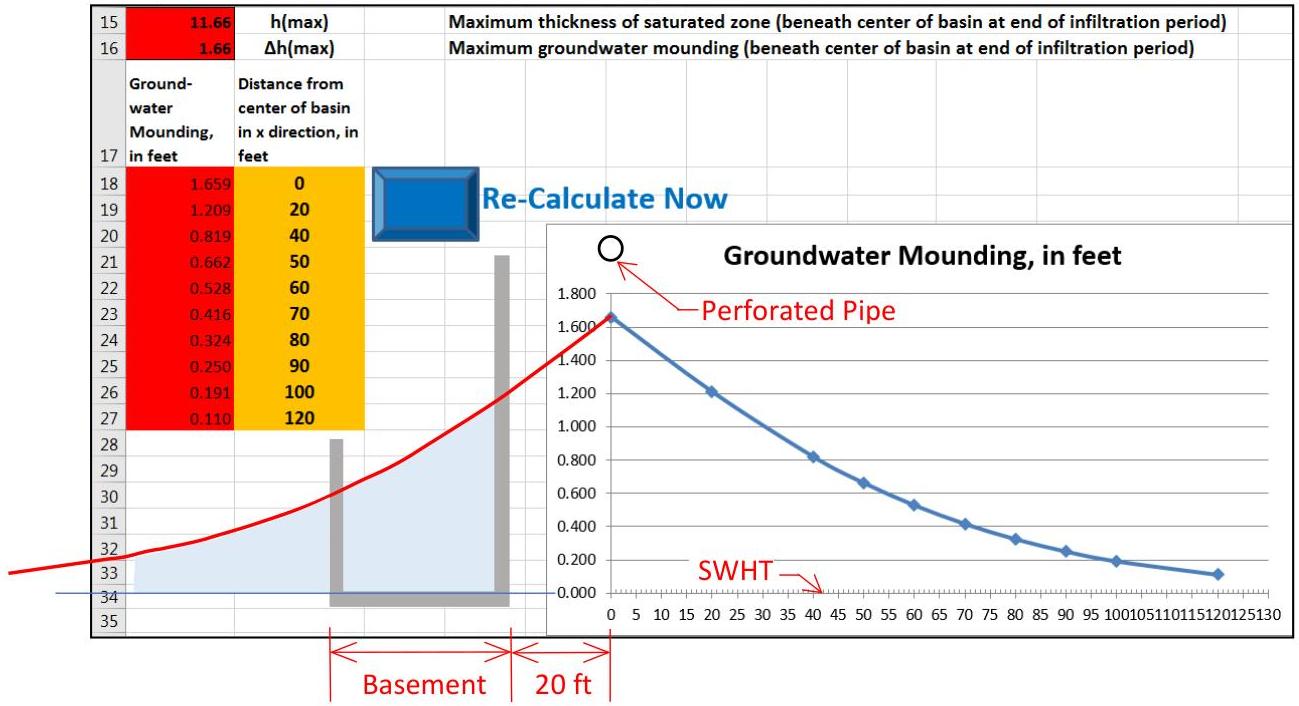
Example 5: Results Section of the Hantush Spreadsheet

Since the calculated mounding height is 1.66 ft, the temporary rise in the groundwater table cause by the infiltration of stormwater will not reach the perforated pipe. However, the effect of the proposed infiltration on the adjacent structures must also be analyzed. The vertical axis shown in the results figure is situated at the centerline of the
PDF page 35, image 1
Mistral ID: img-10.jpeg. Extraction bundle(s): 2023_BMP_13_Groundwater_Mounding_Analysis. Original page | Image file
Surrounding OCR excerpt:
[OCR image]
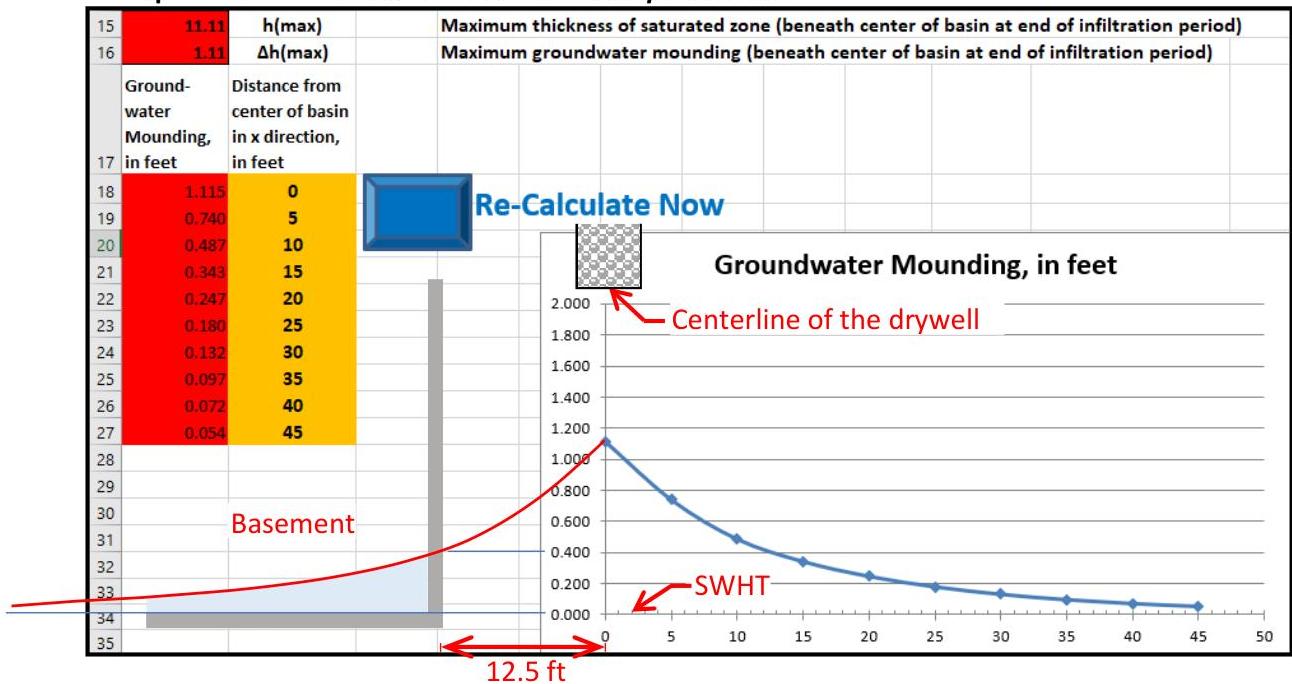
Example 6: Results Section of the Hantush Spreadsheet

The effect of the proposed infiltration on the adjacent structures must also be analyzed. The vertical axis shown in the results figure is situated at the centerline of the drywell, and the groundwater mounding curve is symmetrical on both sides of the vertical axis. The basement is 10 ft away from the edge of the drywell, which is 12.5 ft to the l