{"metadata": {"source_document": "NJ BMP", "version_year": "2026", "chapter_subchapter": "Chapter 5", "citation": "BMP 2026, Ch 5, p. 3", "topic": "Table 1"}, "programmatic_checks": {}, "content_markdown": "# Stormwater Management Quantity and Quality Standards and Computations\n\n## Table 1\n\n| Recurrence Intervals and Probabilities of Occurrences | | |\n| --- | --- | --- |\n| Recurrence Interval, in years | Probability of Occurrence in any Given Year | Percent Chance of Occurrence in any Given Year |\n| 100 | 1 in 100 | 1 |\n| 50 | 1 in 50 | 2 |\n| 25 | 1 in 25 | 4 |\n| 10 | 1 in 10 | 10 |\n| 5 | 1 in 5 | 20 |\n| 2 | 1 in 2 | 50 |\n\nSource context and notes:\n\n\nSource revision: January 2026.\n\n- For example, the recurrence interval of a rainfall event that has a 50% chance of occurrence in a given year is expressed as the 2-year (= 100 ÷ 50) recurrence interval, which is also known as the 2-year storm.\n- For a storm event with a 1% chance of occurrence, it has a 100-year (= 100 ÷ 1) recurrence interval and is referred to as the 100-year storm.\n\nReferring to a precipitation event as the \"X-year storm\" does not mean that this storm can only happen once every X years. Nor does it mean that a larger storm event cannot also occur that year. The table below lists the probability of a particular occurrence and its corresponding chance of occurring, expressed as a percentage, in a single year.\n\n\n| Recurrence Intervals and Probabilities of Occurrences | | |\n| --- | --- | --- |\n| Recurrence Interval, in years | Probability of Occurrence in any Given Year | Percent Chance of Occurrence in any Given Year |\n| 100 | 1 in 100 | 1 |\n| 50 | 1 in 50 | 2 |\n| 25 | 1 in 25 | 4 |\n| 10 | 1 in 10 | 10 |\n| 5 | 1 in 5 | 20 |\n| 2 | 1 in 2 | 50 |\n\n\nAnother aspect of the frequency analysis is the duration of rainfall events. The frequency analysis may use the rainfall depths observed in events having various durations of precipitation, such as 1 hour, 6 hours, or even 3 days, although a 24-hour duration is typically used.\n\nThere are organizations that collect and publish hydrological data, such as National Oceanic and Atmospheric Administration's (NOAA) National Weather Service (NWS), which publishes and updates hydrological data and frequency analysis of rainfall depth and intensity constantly, under normal operating conditions. The National Engineering Handbook (NEH) produced by the NRCS uses NWS data due to its availability and lengths of record. Therefore, in this chapter, NOAA data is referenced in the calculations involving the rainfall depths and intensities for the 2-, 10- and 100-year storm events. A more detailed discussion of using NOAA data is found beginning on Page 13.\n\n# Regulatory Requirements of the Stormwater Management Rules\n\n[Source PDF](SOURCE.pdf#page=3)"}
{"metadata": {"source_document": "NJ BMP", "version_year": "2026", "chapter_subchapter": "Chapter 5", "citation": "BMP 2026, Ch 5, p. 11", "topic": "Table 5-1: NRCS Methodology Index of Information Required"}, "programmatic_checks": {}, "content_markdown": "# Stormwater Management Quantity and Quality Standards and Computations\n\n## Table 5-1: NRCS Methodology Index of Information Required\n\n| Topic No. | Information Required to use the NRCS Methodology | Page No. |\n| --- | --- | --- |\n| 1 | Hydrologic Soil Group of the drainage area soil | 12 |\n| 2 | Sub-drainage areas | 12 |\n| 3 | Land cover | 12 |\n| 4 | Rainfall depth for the stormwater runoff quantity control design storms | 13 |\n| 5 | Rainfall distribution for the stormwater runoff quantity control design storms | 20 |\n| 6 | Rainfall depth for the stormwater runoff water quality design storm | 21 |\n| 7 | Rainfall distribution for the stormwater runoff water quality design storm | 21 |\n| 8 | Time of travel and time of concentration | 24 |\n| 8 | Maximum sheet flow roughness coefficient | 24 |\n| 8 | Sheet flow length | 25 |\n| 8 | Shallow concentrated flow | 26 |\n| 8 | Open channel flow | 27 |\n| 8 | T_{c} routes | 28 |\n| 9 | Runoff Hydrographs | 28 |\n| 10 | Directly Connected Impervious Cover | 31 |\n| 11 | Unconnected Impervious Cover | 32 |\n| 12 | Reduced Curve Numbers | 33 |\n| 13 | Calculating the Peak Flow Rate of Runoff for the WQDS | 33 |\n\nSource context and notes:\n\n# Stormwater Management Quantity and Quality Standards and Computations\n\nSource revision: January 2026.\n\nTable 5-1: NRCS Methodology Index of Information Required\n\n\n| Topic No. | Information Required to use the NRCS Methodology | Page No. |\n| --- | --- | --- |\n| 1 | Hydrologic Soil Group of the drainage area soil | 12 |\n| 2 | Sub-drainage areas | 12 |\n| 3 | Land cover | 12 |\n| 4 | Rainfall depth for the stormwater runoff quantity control design storms | 13 |\n| 5 | Rainfall distribution for the stormwater runoff quantity control design storms | 20 |\n| 6 | Rainfall depth for the stormwater runoff water quality design storm | 21 |\n| 7 | Rainfall distribution for the stormwater runoff water quality design storm | 21 |\n| 8 | Time of travel and time of concentration | 24 |\n| 8 | Maximum sheet flow roughness coefficient | 24 |\n| 8 | Sheet flow length | 25 |\n| 8 | Shallow concentrated flow | 26 |\n| 8 | Open channel flow | 27 |\n| 8 | T_{c} routes | 28 |\n| 9 | Runoff Hydrographs | 28 |\n| 10 | Directly Connected Impervious Cover | 31 |\n| 11 | Unconnected Impervious Cover | 32 |\n| 12 | Reduced Curve Numbers | 33 |\n| 13 | Calculating the Peak Flow Rate of Runoff for the WQDS | 33 |\n\n\n\n[Source PDF](SOURCE.pdf#page=11)"}
{"metadata": {"source_document": "NJ BMP", "version_year": "2026", "chapter_subchapter": "Chapter 5", "citation": "BMP 2026, Ch 5, p. 16", "topic": "Table 5-2: County-Specific, New Jersey 24-Hour Rainfall Frequency Data"}, "programmatic_checks": {}, "content_markdown": "# Stormwater Management Quantity and Quality Standards and Computations\n\n## Table 5-2: County-Specific, New Jersey 24-Hour Rainfall Frequency Data\n\n| NEW JERSEY 24 HOUR RAINFALL FREQUENCY DATA | | | | | | | |\n| --- | --- | --- | --- | --- | --- | --- | --- |\n| Rainfall amounts in Inches | | | | | | | |\n| County | 1 year | 2 year | 5 year | 10 year | 25 year | 50 year | 100 year |\n| Atlantic | 2.72 | 3.31 | 4.30 | 5.16 | 6.46 | 7.61 | 8.90 |\n| Bergen | 2.75 | 3.34 | 4.27 | 5.07 | 6.28 | 7.32 | 8.47 |\n| Burlington | 2.77 | 3.36 | 4.34 | 5.18 | 6.45 | 7.56 | 8.81 |\n| Camden | 2.73 | 3.31 | 4.25 | 5.06 | 6.28 | 7.34 | 8.52 |\n| Cape May | 2.67 | 3.25 | 4.22 | 5.07 | 6.34 | 7.47 | 8.73 |\n| Cumberland | 2.69 | 3.27 | 4.25 | 5.09 | 6.37 | 7.49 | 8.76 |\n| Essex | 2.85 | 3.44 | 4.40 | 5.22 | 6.44 | 7.49 | 8.66 |\n| Gloucester | 2.71 | 3.29 | 4.24 | 5.05 | 6.29 | 7.36 | 8.55 |\n| Hudson | 2.73 | 3.31 | 4.23 | 5.02 | 6.19 | 7.20 | 8.31 |\n| Hunterdon | 2.80 | 3.38 | 4.26 | 5.00 | 6.09 | 7.02 | 8.03 |\n| Mercer | 2.74 | 3.31 | 4.23 | 5.01 | 6.19 | 7.20 | 8.33 |\n| Middlesex | 2.76 | 3.35 | 4.30 | 5.12 | 6.36 | 7.43 | 8.63 |\n| Monmouth | 2.79 | 3.38 | 4.38 | 5.23 | 6.53 | 7.66 | 8.94 |\n| Morris | 2.94 | 3.54 | 4.47 | 5.24 | 6.37 | 7.32 | 8.35 |\n| Ocean | 2.81 | 3.42 | 4.45 | 5.33 | 6.68 | 7.87 | 9.20 |\n| Passaic | 2.87 | 3.47 | 4.42 | 5.23 | 6.43 | 7.47 | 8.62 |\n| Salem | 2.69 | 3.26 | 4.20 | 5.00 | 6.22 | 7.28 | 8.45 |\n| Somerset | 2.76 | 3.34 | 4.25 | 5.01 | 6.15 | 7.13 | 8.21 |\n| Sussex | 2.68 | 3.22 | 4.02 | 4.70 | 5.72 | 6.60 | 7.58 |\n| Union | 2.80 | 3.39 | 4.35 | 5.17 | 6.42 | 7.49 | 8.69 |\n| Warren | 2.78 | 3.34 | 4.18 | 4.89 | 5.93 | 6.83 | 7.82 |\n| Notes: The average point rainfall amounts listed above were developed from data contained in NOAA Atlas 14 Volume 2.
Point rainfall estimates for specific locations may be obtained from the Precipitation Frequency Data Server located at http://www.nws.noa.gov/ohd/hdsc/.
For most hydrologic design procedures, the rainfall amounts listed above may be rounded to the nearest tenth of an inch. | | | | | | | |\n\nSource context and notes:\n\nSource revision: January 2026.\n\nii. N.J.A.C. 7:8-5.7(c) and N.J.A.C. 7:8-5.7(d) both allow an alternative to calculating the current and projected rainfall precipitation depths by using separate rainfall totals for each county. The 24-hour county rainfall amount provided by NRCS is duplicated here and can be found online at:\n\nhttps://www.nrcs.usda.gov/sites/default/files/2022-09/NJ%2024%20Hour%20Rainfall%20Data.pdf.\n\nTable 5-2: County-Specific, New Jersey 24-Hour Rainfall Frequency Data\n\n\n| NEW JERSEY 24 HOUR RAINFALL FREQUENCY DATA | | | | | | | |\n| --- | --- | --- | --- | --- | --- | --- | --- |\n| Rainfall amounts in Inches | | | | | | | |\n| County | 1 year | 2 year | 5 year | 10 year | 25 year | 50 year | 100 year |\n| Atlantic | 2.72 | 3.31 | 4.30 | 5.16 | 6.46 | 7.61 | 8.90 |\n| Bergen | 2.75 | 3.34 | 4.27 | 5.07 | 6.28 | 7.32 | 8.47 |\n| Burlington | 2.77 | 3.36 | 4.34 | 5.18 | 6.45 | 7.56 | 8.81 |\n| Camden | 2.73 | 3.31 | 4.25 | 5.06 | 6.28 | 7.34 | 8.52 |\n| Cape May | 2.67 | 3.25 | 4.22 | 5.07 | 6.34 | 7.47 | 8.73 |\n| Cumberland | 2.69 | 3.27 | 4.25 | 5.09 | 6.37 | 7.49 | 8.76 |\n| Essex | 2.85 | 3.44 | 4.40 | 5.22 | 6.44 | 7.49 | 8.66 |\n| Gloucester | 2.71 | 3.29 | 4.24 | 5.05 | 6.29 | 7.36 | 8.55 |\n| Hudson | 2.73 | 3.31 | 4.23 | 5.02 | 6.19 | 7.20 | 8.31 |\n| Hunterdon | 2.80 | 3.38 | 4.26 | 5.00 | 6.09 | 7.02 | 8.03 |\n| Mercer | 2.74 | 3.31 | 4.23 | 5.01 | 6.19 | 7.20 | 8.33 |\n| Middlesex | 2.76 | 3.35 | 4.30 | 5.12 | 6.36 | 7.43 | 8.63 |\n| Monmouth | 2.79 | 3.38 | 4.38 | 5.23 | 6.53 | 7.66 | 8.94 |\n| Morris | 2.94 | 3.54 | 4.47 | 5.24 | 6.37 | 7.32 | 8.35 |\n| Ocean | 2.81 | 3.42 | 4.45 | 5.33 | 6.68 | 7.87 | 9.20 |\n| Passaic | 2.87 | 3.47 | 4.42 | 5.23 | 6.43 | 7.47 | 8.62 |\n| Salem | 2.69 | 3.26 | 4.20 | 5.00 | 6.22 | 7.28 | 8.45 |\n| Somerset | 2.76 | 3.34 | 4.25 | 5.01 | 6.15 | 7.13 | 8.21 |\n| Sussex | 2.68 | 3.22 | 4.02 | 4.70 | 5.72 | 6.60 | 7.58 |\n| Union | 2.80 | 3.39 | 4.35 | 5.17 | 6.42 | 7.49 | 8.69 |\n| Warren | 2.78 | 3.34 | 4.18 | 4.89 | 5.93 | 6.83 | 7.82 |\n| Notes: The average point rainfall amounts listed above were developed from data contained in NOAA Atlas 14 Volume 2.
Point rainfall estimates for specific locations may be obtained from the Precipitation Frequency Data Server located at http://www.nws.noa.gov/ohd/hdsc/.
For most hydrologic design procedures, the rainfall amounts listed above may be rounded to the nearest tenth of an inch. | | | | | | | |\n\n\n\n[Source PDF](SOURCE.pdf#page=16)"}
{"metadata": {"source_document": "NJ BMP", "version_year": "2026", "chapter_subchapter": "Chapter 5", "citation": "BMP 2026, Ch 5, p. 17", "topic": "Table 4"}, "programmatic_checks": {}, "content_markdown": "# Stormwater Management Quantity and Quality Standards and Computations\n\n## Table 4\n\n| County | Current Precipitation Adjustment Factors | | |\n| --- | --- | --- | --- |\n| | 2-year Design Storm | 10-year Design Storm | 100-year Design Storm |\n| Atlantic | 1.01 | 1.02 | 1.03 |\n| Bergen | 1.01 | 1.03 | 1.06 |\n| Burlington | 0.99 | 1.01 | 1.04 |\n| Camden | 1.03 | 1.04 | 1.05 |\n| Cape May | 1.03 | 1.03 | 1.04 |\n| Cumberland | 1.03 | 1.03 | 1.01 |\n| Essex | 1.01 | 1.03 | 1.06 |\n| Gloucester | 1.05 | 1.06 | 1.06 |\n| Hudson | 1.03 | 1.05 | 1.09 |\n| Hunterdon | 1.02 | 1.05 | 1.13 |\n| Mercer | 1.01 | 1.02 | 1.04 |\n| Middlesex | 1.00 | 1.01 | 1.03 |\n| Monmouth | 1.00 | 1.01 | 1.02 |\n| Morris | 1.01 | 1.03 | 1.06 |\n| Ocean | 1.00 | 1.01 | 1.03 |\n| Passaic | 1.00 | 1.02 | 1.05 |\n| Salem | 1.02 | 1.03 | 1.03 |\n| Somerset | 1.00 | 1.03 | 1.09 |\n| Sussex | 1.03 | 1.04 | 1.07 |\n| Union | 1.01 | 1.03 | 1.06 |\n| Warren | 1.02 | 1.07 | 1.15 |\n\nSource context and notes:\n\n# Stormwater Management Quantity and Quality Standards and Computations\n\nSource revision: January 2026.\n\nb. N.J.A.C.7:8-5.7(c) requires the precipitation depths of the current 2-, 10- and 100-year storm events be determined by multiplying the NOAA rainfall data with the current precipitation adjustment factors in Table 5-5 at N.J.A.C.7:8-5.7(c)2. N.J.A.C.7:8-5.7(d) requires the precipitation depths of the projected 2-, 10- and 100-year storm events be determined by multiplying the NOAA rainfall data with the future precipitation change factors in Table 5-6 at N.J.A.C.7:8-5.7(d). Table 5-5 and Table 5-6 from the Rules are reproduced below.\n\nCurrent Precipitation Adjustment Factors at N.J.A.C. 7:8-5.7(c) as Table 5-5\n\n\n| County | Current Precipitation Adjustment Factors | | |\n| --- | --- | --- | --- |\n| | 2-year Design Storm | 10-year Design Storm | 100-year Design Storm |\n| Atlantic | 1.01 | 1.02 | 1.03 |\n| Bergen | 1.01 | 1.03 | 1.06 |\n| Burlington | 0.99 | 1.01 | 1.04 |\n| Camden | 1.03 | 1.04 | 1.05 |\n| Cape May | 1.03 | 1.03 | 1.04 |\n| Cumberland | 1.03 | 1.03 | 1.01 |\n| Essex | 1.01 | 1.03 | 1.06 |\n| Gloucester | 1.05 | 1.06 | 1.06 |\n| Hudson | 1.03 | 1.05 | 1.09 |\n| Hunterdon | 1.02 | 1.05 | 1.13 |\n| Mercer | 1.01 | 1.02 | 1.04 |\n| Middlesex | 1.00 | 1.01 | 1.03 |\n| Monmouth | 1.00 | 1.01 | 1.02 |\n| Morris | 1.01 | 1.03 | 1.06 |\n| Ocean | 1.00 | 1.01 | 1.03 |\n| Passaic | 1.00 | 1.02 | 1.05 |\n| Salem | 1.02 | 1.03 | 1.03 |\n| Somerset | 1.00 | 1.03 | 1.09 |\n| Sussex | 1.03 | 1.04 | 1.07 |\n| Union | 1.01 | 1.03 | 1.06 |\n| Warren | 1.02 | 1.07 | 1.15 |\n\n\n\n[Source PDF](SOURCE.pdf#page=17)"}
{"metadata": {"source_document": "NJ BMP", "version_year": "2026", "chapter_subchapter": "Chapter 5", "citation": "BMP 2026, Ch 5, p. 18", "topic": "Table 5"}, "programmatic_checks": {}, "content_markdown": "# Stormwater Management Quantity and Quality Standards and Computations\n\n## Table 5\n\n| County | Future Precipitation Change Factors | | |\n| --- | --- | --- | --- |\n| | 2-year Design Storm | 10-year Design Storm | 100-year Design Storm |\n| Atlantic | 1.22 | 1.24 | 1.39 |\n| Bergen | 1.20 | 1.23 | 1.37 |\n| Burlington | 1.17 | 1.18 | 1.32 |\n| Camden | 1.18 | 1.22 | 1.39 |\n| Cape May | 1.21 | 1.24 | 1.32 |\n| Cumberland | 1.20 | 1.21 | 1.39 |\n| Essex | 1.19 | 1.22 | 1.33 |\n| Gloucester | 1.19 | 1.23 | 1.41 |\n| Hudson | 1.19 | 1.19 | 1.23 |\n| Hunterdon | 1.19 | 1.23 | 1.42 |\n| Mercer | 1.16 | 1.17 | 1.36 |\n| Middlesex | 1.19 | 1.21 | 1.33 |\n| Monmouth | 1.19 | 1.19 | 1.26 |\n| Morris | 1.23 | 1.28 | 1.46 |\n| Ocean | 1.18 | 1.19 | 1.24 |\n| Passaic | 1.21 | 1.27 | 1.50 |\n| Salem | 1.20 | 1.23 | 1.32 |\n| Somerset | 1.19 | 1.24 | 1.48 |\n| Sussex | 1.24 | 1.29 | 1.50 |\n| Union | 1.20 | 1.23 | 1.35 |\n| Warren | 1.20 | 1.25 | 1.37 |\n\nSource context and notes:\n\n# Stormwater Management Quantity and Quality Standards and Computations\n\nSource revision: January 2026.\n\nFuture Precipitation Change Factors at N.J.A.C. 7:8-5.7(d) as Table 5-6\n\n\n| County | Future Precipitation Change Factors | | |\n| --- | --- | --- | --- |\n| | 2-year Design Storm | 10-year Design Storm | 100-year Design Storm |\n| Atlantic | 1.22 | 1.24 | 1.39 |\n| Bergen | 1.20 | 1.23 | 1.37 |\n| Burlington | 1.17 | 1.18 | 1.32 |\n| Camden | 1.18 | 1.22 | 1.39 |\n| Cape May | 1.21 | 1.24 | 1.32 |\n| Cumberland | 1.20 | 1.21 | 1.39 |\n| Essex | 1.19 | 1.22 | 1.33 |\n| Gloucester | 1.19 | 1.23 | 1.41 |\n| Hudson | 1.19 | 1.19 | 1.23 |\n| Hunterdon | 1.19 | 1.23 | 1.42 |\n| Mercer | 1.16 | 1.17 | 1.36 |\n| Middlesex | 1.19 | 1.21 | 1.33 |\n| Monmouth | 1.19 | 1.19 | 1.26 |\n| Morris | 1.23 | 1.28 | 1.46 |\n| Ocean | 1.18 | 1.19 | 1.24 |\n| Passaic | 1.21 | 1.27 | 1.50 |\n| Salem | 1.20 | 1.23 | 1.32 |\n| Somerset | 1.19 | 1.24 | 1.48 |\n| Sussex | 1.24 | 1.29 | 1.50 |\n| Union | 1.20 | 1.23 | 1.35 |\n| Warren | 1.20 | 1.25 | 1.37 |\n\n\n\n[Source PDF](SOURCE.pdf#page=18)"}
{"metadata": {"source_document": "NJ BMP", "version_year": "2026", "chapter_subchapter": "Chapter 5", "citation": "BMP 2026, Ch 5, p. 19", "topic": "Table 6"}, "programmatic_checks": {}, "content_markdown": "# Stormwater Management Quantity and Quality Standards and Computations\n\n## Table 6\n\n| Frequency of Storms | NOAA NWS PFDS Rainfall Depth (inches) | Current Precipitation Adjustment Factor | Current Rainfall Depth (inches) |\n| --- | --- | --- | --- |\n| 2-year | 3.33 | 1.01 | 3.36 |\n| 10-year | 4.99 | 1.02 | 5.09 |\n| 100-year | 8.15 | 1.04 | 8.48 |\n\nSource context and notes:\n\n# Stormwater Management Quantity and Quality Standards and Computations\n\nSource revision: January 2026.\n\nExample B-1: Apply the current precipitation adjustment factors for the site depicted in Example A-1.\n\nThe table below includes the rainfall depths from Example A-1 and the Mercer County current precipitation adjustment factors from Table 5-5 in the Stormwater Management rules for the site located in Trenton, NJ. To obtain the current precipitation depth for the 2-year design storm, multiply the precipitation depth for the 2-year design storm by the 2-year current precipitation adjustment factor. Repeat the process for the 10- and 100-year design storms using the respective adjustment factor. The results are depicted in the column farthest to the right in the table below.\n\n\n| Frequency of Storms | NOAA NWS PFDS Rainfall Depth (inches) | Current Precipitation Adjustment Factor | Current Rainfall Depth (inches) |\n| --- | --- | --- | --- |\n| 2-year | 3.33 | 1.01 | 3.36 |\n| 10-year | 4.99 | 1.02 | 5.09 |\n| 100-year | 8.15 | 1.04 | 8.48 |\n\n\nExample B-2: Determine the current precipitation adjustment factors for a site with one-third of the area located in Middlesex County and the remainder in Mercer County.\n\nIn the event a project spans the boundary line(s) between counties, N.J.A.C. 7:8-5.7(c)2 instructs the user as follows: \"Where the major development lies in more than one county, the precipitation values shall be adjusted according to the percentage of the drainage area in each county.\"\n\nStep 1: Obtain the current precipitation for each of the counties.\n\n[Source PDF](SOURCE.pdf#page=19)"}
{"metadata": {"source_document": "NJ BMP", "version_year": "2026", "chapter_subchapter": "Chapter 5", "citation": "BMP 2026, Ch 5, p. 19", "topic": "Table 7"}, "programmatic_checks": {}, "content_markdown": "# Stormwater Management Quantity and Quality Standards and Computations\n\n## Table 7\n\n| County | Current Precipitation | | |\n| --- | --- | --- | --- |\n| | 2-year Design Storm | 10-year Design Storm | 100-year Design Storm |\n| Middlesex | 3.35 * 1.00 = 3.35 | 5.12 * 1.01 = 5.17 | 8.63 * 1.03 = 8.89 |\n| Mercer | 3.31 * 1.01 = 3.34 | 5.01 * 1.02 = 5.11 | 8.33 * 1.04 = 8.66 |\n\nSource context and notes:\n\n| 100-year | 8.15 | 1.04 | 8.48 |\n\nExample B-2: Determine the current precipitation adjustment factors for a site with one-third of the area located in Middlesex County and the remainder in Mercer County.\n\nIn the event a project spans the boundary line(s) between counties, N.J.A.C. 7:8-5.7(c)2 instructs the user as follows: \"Where the major development lies in more than one county, the precipitation values shall be adjusted according to the percentage of the drainage area in each county.\"\n\nStep 1: Obtain the current precipitation for each of the counties.\n\n\n| County | Current Precipitation | | |\n| --- | --- | --- | --- |\n| | 2-year Design Storm | 10-year Design Storm | 100-year Design Storm |\n| Middlesex | 3.35 * 1.00 = 3.35 | 5.12 * 1.01 = 5.17 | 8.63 * 1.03 = 8.89 |\n| Mercer | 3.31 * 1.01 = 3.34 | 5.01 * 1.02 = 5.11 | 8.33 * 1.04 = 8.66 |\n\n\nThe method is the same as that shown above in Example A-1, but is performed for each of counties using the respective current precipitation adjustment factor.\n\nStep 2: Multiply the percentage of the project area within each county with the current precipitation for the respective county, and sum the results for each of the design storms, pursuant to N.J.A.C. 7:8-5.7(c)2.\n\nThe results are shown in the following table.\n\n[Source PDF](SOURCE.pdf#page=19)"}
{"metadata": {"source_document": "NJ BMP", "version_year": "2026", "chapter_subchapter": "Chapter 5", "citation": "BMP 2026, Ch 5, p. 20", "topic": "Table 8"}, "programmatic_checks": {}, "content_markdown": "# Stormwater Management Quantity and Quality Standards and Computations\n\n## Table 8\n\n| County, Weight Averaged | Current Precipitation | | |\n| --- | --- | --- | --- |\n| | 2-year Design Storm | 10-year Design Storm | 100-year Design Storm |\n| Middlesex | 0.333 * 3.35 = 1.12 | 0.333 * 5.17 = 1.72 | 0.333 * 8.89 = 2.96 |\n| Mercer | + 0.667 * 3.34 = 2.23 | + 0.667 * 5.11 = 3.41 | + 0.667 * 8.66 = 5.78 |\n| Total Site Precipitation | 3.35 | 5.13 | 8.74 |\n\nSource context and notes:\n\n# Stormwater Management Quantity and Quality Standards and Computations\n\nSource revision: January 2026.\n\n\n| County, Weight Averaged | Current Precipitation | | |\n| --- | --- | --- | --- |\n| | 2-year Design Storm | 10-year Design Storm | 100-year Design Storm |\n| Middlesex | 0.333 * 3.35 = 1.12 | 0.333 * 5.17 = 1.72 | 0.333 * 8.89 = 2.96 |\n| Mercer | + 0.667 * 3.34 = 2.23 | + 0.667 * 5.11 = 3.41 | + 0.667 * 8.66 = 5.78 |\n| Total Site Precipitation | 3.35 | 5.13 | 8.74 |\n\n\n5. Rainfall distribution for the stormwater runoff quantity control design storms: In addition to the rainfall depth, knowing how rain falls during a storm event is important in calculating the peak flow rate of the stormwater runoff generated. Keep in mind that, generally, a precipitation event typically begins with a lighter intensity of rain falling, followed by a period during which rain falls at a higher intensity before gently tapering off. To achieve the goal of estimating rainfall events for design and planning purposes, between 1961 and 1977, NRCS developed synthetic rainfall distributions from historical records from the different regions of the country. These rainfall distributions were based upon the assumption that the rain distribution is bell-shaped, meaning it has less rainfall in the beginning and at the end of the rain event. The NRCS rainfall distributions were grouped into four types according to the applicable regions or geographic situations. Types I and IA represented the Pacific maritime climate with wet winters and dry summers. Type III represented the Gulf of Mexico and Atlantic coastal areas, including New Jersey, where tropical storms produced large 24-hour rainfall events. Type II represented the rest of the country. These NRCS rainfall distributions had durations of 24-, 18-, 12- or 6-hours.\n\nOn September 10, 2012, NCRS issued a note, NEW JERSEY BULLETIN NO. NJ210-12-1, stating that:\n\nBased on updated rainfall data from NOAA, NRCS has developed new storm distributions for use with EFH-2 and WinTR-55. New Jersey has two new rainfall distribution regions: Region C covering the counties of Sussex, Warren, Hunterdon, Somerset, Mercer, Burlington, Camden, Gloucester, Atlantic, Salem, Cumberland, and Cape May; and Region D covering Bergen, Hudson, Essex, Passaic, Morris, Union, Middlesex, Monmouth and Ocean. The new rainfall distributions replace use of the TYPE III distribution in New Jersey. The 24-hour rainfall-frequency data has been updated as well with only minor variations for some of the counties.\n\n[Source PDF](SOURCE.pdf#page=20)"}
{"metadata": {"source_document": "NJ BMP", "version_year": "2026", "chapter_subchapter": "Chapter 5", "citation": "BMP 2026, Ch 5, p. 23", "topic": "Table 5-3: NJDEP 1.25-Inch/2-Hour Stormwater Runoff Water Quality Design Storm Rainfall Distribution"}, "programmatic_checks": {}, "content_markdown": "# Stormwater Management Quantity and Quality Standards and Computations\n\n## Table 5-3: NJDEP 1.25-Inch/2-Hour Stormwater Runoff Water Quality Design Storm Rainfall Distribution\n\n| Time (Minutes) | Cumulative Rainfall (Inches) | Time (Minutes) | Cumulative Rainfall (Inches) | Time (Minutes) | Cumulative Rainfall (Inches) |\n| --- | --- | --- | --- | --- | --- |\n| 1 | 0.00166 | 41 | 0.1728 | 81 | 1.0906 |\n| 2 | 0.00332 | 42 | 0.1796 | 82 | 1.0972 |\n| 3 | 0.00498 | 43 | 0.1864 | 83 | 1.1038 |\n| 4 | 0.00664 | 44 | 0.1932 | 84 | 1.1104 |\n| 5 | 0.00830 | 45 | 0.2000 | 85 | 1.1170 |\n| 6 | 0.00996 | 46 | 0.2117 | 86 | 1.1236 |\n| 7 | 0.01162 | 47 | 0.2233 | 87 | 1.1302 |\n| 8 | 0.01328 | 48 | 0.2350 | 88 | 1.1368 |\n| 9 | 0.01494 | 49 | 0.2466 | 89 | 1.1434 |\n| 10 | 0.01660 | 50 | 0.2583 | 90 | 1.1500 |\n| 11 | 0.01828 | 51 | 0.2783 | 91 | 1.1550 |\n| 12 | 0.01996 | 52 | 0.2983 | 92 | 1.1600 |\n| 13 | 0.02164 | 53 | 0.3183 | 93 | 1.1650 |\n| 14 | 0.02332 | 54 | 0.3383 | 94 | 1.1700 |\n| 15 | 0.02500 | 55 | 0.3583 | 95 | 1.1750 |\n| 16 | 0.03000 | 56 | 0.4116 | 96 | 1.1800 |\n| 17 | 0.03500 | 57 | 0.4650 | 97 | 1.1850 |\n| 18 | 0.04000 | 58 | 0.5183 | 98 | 1.1900 |\n| 19 | 0.04500 | 59 | 0.5717 | 99 | 1.1950 |\n| 20 | 0.05000 | 60 | 0.6250 | 100 | 1.2000 |\n| 21 | 0.05500 | 61 | 0.6783 | 101 | 1.2050 |\n| 22 | 0.06000 | 62 | 0.7317 | 102 | 1.2100 |\n| 23 | 0.06500 | 63 | 0.7850 | 103 | 1.2150 |\n| 24 | 0.07000 | 64 | 0.8384 | 104 | 1.2200 |\n| 25 | 0.07500 | 65 | 0.8917 | 105 | 1.2250 |\n| 26 | 0.08000 | 66 | 0.9117 | 106 | 1.2267 |\n| 27 | 0.08500 | 67 | 0.9317 | 107 | 1.2284 |\n| 28 | 0.09000 | 68 | 0.9517 | 108 | 1.2300 |\n| 29 | 0.09500 | 69 | 0.9717 | 109 | 1.2317 |\n| 30 | 0.10000 | 70 | 0.9917 | 110 | 1.2334 |\n| 31 | 0.10660 | 71 | 1.0034 | 111 | 1.2351 |\n| 32 | 0.11320 | 72 | 1.0150 | 112 | 1.2367 |\n| 33 | 0.11980 | 73 | 1.0267 | 113 | 1.2384 |\n| 34 | 0.12640 | 74 | 1.0383 | 114 | 1.2400 |\n| 35 | 0.13300 | 75 | 1.0500 | 115 | 1.2417 |\n| 36 | 0.13960 | 76 | 1.0568 | 116 | 1.2434 |\n| 37 | 0.14620 | 77 | 1.0636 | 117 | 1.2450 |\n| 38 | 0.15280 | 78 | 1.0704 | 118 | 1.2467 |\n| 39 | 0.15940 | 79 | 1.0772 | 119 | 1.2483 |\n| 40 | 0.16600 | 80 | 1.0840 | 120 | 1.2500 |\n\nSource context and notes:\n\n# Stormwater Management Quantity and Quality Standards and Computations\n\nSource revision: January 2026.\n\nTable 5-3: NJDEP 1.25-Inch/2-Hour Stormwater Runoff Water Quality Design Storm Rainfall Distribution\n\n\n| Time (Minutes) | Cumulative Rainfall (Inches) | Time (Minutes) | Cumulative Rainfall (Inches) | Time (Minutes) | Cumulative Rainfall (Inches) |\n| --- | --- | --- | --- | --- | --- |\n| 1 | 0.00166 | 41 | 0.1728 | 81 | 1.0906 |\n| 2 | 0.00332 | 42 | 0.1796 | 82 | 1.0972 |\n| 3 | 0.00498 | 43 | 0.1864 | 83 | 1.1038 |\n| 4 | 0.00664 | 44 | 0.1932 | 84 | 1.1104 |\n| 5 | 0.00830 | 45 | 0.2000 | 85 | 1.1170 |\n| 6 | 0.00996 | 46 | 0.2117 | 86 | 1.1236 |\n| 7 | 0.01162 | 47 | 0.2233 | 87 | 1.1302 |\n| 8 | 0.01328 | 48 | 0.2350 | 88 | 1.1368 |\n| 9 | 0.01494 | 49 | 0.2466 | 89 | 1.1434 |\n| 10 | 0.01660 | 50 | 0.2583 | 90 | 1.1500 |\n| 11 | 0.01828 | 51 | 0.2783 | 91 | 1.1550 |\n| 12 | 0.01996 | 52 | 0.2983 | 92 | 1.1600 |\n| 13 | 0.02164 | 53 | 0.3183 | 93 | 1.1650 |\n| 14 | 0.02332 | 54 | 0.3383 | 94 | 1.1700 |\n| 15 | 0.02500 | 55 | 0.3583 | 95 | 1.1750 |\n| 16 | 0.03000 | 56 | 0.4116 | 96 | 1.1800 |\n| 17 | 0.03500 | 57 | 0.4650 | 97 | 1.1850 |\n| 18 | 0.04000 | 58 | 0.5183 | 98 | 1.1900 |\n| 19 | 0.04500 | 59 | 0.5717 | 99 | 1.1950 |\n| 20 | 0.05000 | 60 | 0.6250 | 100 | 1.2000 |\n| 21 | 0.05500 | 61 | 0.6783 | 101 | 1.2050 |\n| 22 | 0.06000 | 62 | 0.7317 | 102 | 1.2100 |\n| 23 | 0.06500 | 63 | 0.7850 | 103 | 1.2150 |\n| 24 | 0.07000 | 64 | 0.8384 | 104 | 1.2200 |\n| 25 | 0.07500 | 65 | 0.8917 | 105 | 1.2250 |\n| 26 | 0.08000 | 66 | 0.9117 | 106 | 1.2267 |\n| 27 | 0.08500 | 67 | 0.9317 | 107 | 1.2284 |\n| 28 | 0.09000 | 68 | 0.9517 | 108 | 1.2300 |\n| 29 | 0.09500 | 69 | 0.9717 | 109 | 1.2317 |\n| 30 | 0.10000 | 70 | 0.9917 | 110 | 1.2334 |\n| 31 | 0.10660 | 71 | 1.0034 | 111 | 1.2351 |\n| 32 | 0.11320 | 72 | 1.0150 | 112 | 1.2367 |\n| 33 | 0.11980 | 73 | 1.0267 | 113 | 1.2384 |\n| 34 | 0.12640 | 74 | 1.0383 | 114 | 1.2400 |\n| 35 | 0.13300 | 75 | 1.0500 | 115 | 1.2417 |\n| 36 | 0.13960 | 76 | 1.0568 | 116 | 1.2434 |\n| 37 | 0.14620 | 77 | 1.0636 | 117 | 1.2450 |\n| 38 | 0.15280 | 78 | 1.0704 | 118 | 1.2467 |\n| 39 | 0.15940 | 79 | 1.0772 | 119 | 1.2483 |\n| 40 | 0.16600 | 80 | 1.0840 | 120 | 1.2500 |\n\n\n\n[Source PDF](SOURCE.pdf#page=23)"}
{"metadata": {"source_document": "NJ BMP", "version_year": "2026", "chapter_subchapter": "Chapter 5", "citation": "BMP 2026, Ch 5, p. 25", "topic": "Table 15-1 Manning's roughness coefficients for sheet flow (flow depth generally ≤ 0.1 ft)"}, "programmatic_checks": {}, "content_markdown": "# Stormwater Management Quantity and Quality Standards and Computations\n\n## Table 15-1 Manning's roughness coefficients for sheet flow (flow depth generally ≤ 0.1 ft)\n\n| Table 15-1 Manning's roughness coefficients for sheet flow (flow depth generally ≤ 0.1 ft) | |\n| --- | --- |\n| Surface description | n1/ |\n| Smooth surface (concrete, asphalt, gravel, or bare soil) | 0.011 |\n| Fallow (no residue) | 0.05 |\n| Cultivated soils: | |\n| Residue cover ≤ 20% | 0.06 |\n| Residue cover > 20% | 0.17 |\n| Grass: | |\n| Short-grass prairie | 0.15 |\n| Dense grasses2/ | 0.24 |\n| Bermudagrass | 0.41 |\n| Range (natural) | 0.13 |\n| Woods:3/ | |\n| Light underbrush | 0.40 |\n| Dense underbrush | 0.80 |\n| 1 The Manning's n values are a composite of information compiled by Engman (1986). | |\n| 2 Includes species such as weeping lovegrass, bluegrass, buffalo grass, blue grama grass, and native grass mixtures. | |\n| 3 When selecting n, consider cover to a height of about 0.1 ft. This is the only part of the plant cover that will obstruct sheet flow. | |\n\nSource context and notes:\n\n# Stormwater Management Quantity and Quality Standards and Computations\n\nSource revision: January 2026.\n\nFigure 5-12: Manning's Roughness Coefficients for Sheet Flow\n\n\n| Table 15-1 Manning's roughness coefficients for sheet flow (flow depth generally ≤ 0.1 ft) | |\n| --- | --- |\n| Surface description | n1/ |\n| Smooth surface (concrete, asphalt, gravel, or bare soil) | 0.011 |\n| Fallow (no residue) | 0.05 |\n| Cultivated soils: | |\n| Residue cover ≤ 20% | 0.06 |\n| Residue cover > 20% | 0.17 |\n| Grass: | |\n| Short-grass prairie | 0.15 |\n| Dense grasses2/ | 0.24 |\n| Bermudagrass | 0.41 |\n| Range (natural) | 0.13 |\n| Woods:3/ | |\n| Light underbrush | 0.40 |\n| Dense underbrush | 0.80 |\n| 1 The Manning's n values are a composite of information compiled by Engman (1986). | |\n| 2 Includes species such as weeping lovegrass, bluegrass, buffalo grass, blue grama grass, and native grass mixtures. | |\n| 3 When selecting n, consider cover to a height of about 0.1 ft. This is the only part of the plant cover that will obstruct sheet flow. | |\n\n\n- Sheet Flow Length:\n\n☐ For the pre-construction condition, the user assumes a sheet flow length of 100 ft. Only when there is something physically in contact with the flow of stormwater runoff to prevent sheet flow from occurring, such as a swale, curb or inlet, shall the value used be less than 100 ft.\n\n☐ For the post-construction condition, the maximum sheet flow length should not exceed the McCuen-Spiess limitation or 100 ft, whichever is shorter. The McCuen-Spiess limitation is calculated as follows:\n\n[Source PDF](SOURCE.pdf#page=25)"}
{"metadata": {"source_document": "NJ BMP", "version_year": "2026", "chapter_subchapter": "Chapter 5", "citation": "BMP 2026, Ch 5, p. 26", "topic": "Table 15-3 Equations and assumptions developed from figure 15-4"}, "programmatic_checks": {}, "content_markdown": "# Stormwater Management Quantity and Quality Standards and Computations\n\n## Table 15-3 Equations and assumptions developed from figure 15-4\n\n| Table 15-3 Equations and assumptions developed from figure 15-4 | | | |\n| --- | --- | --- | --- |\n| Flow type | Depth (ft) | Manning's n | Velocity equation (ft/s) |\n| Pavement and small upland gullies | 0.2 | 0.025 | V=20.328(s)1-1 |\n| Grassed waterways | 0.4 | 0.050 | V=16.135(s)1-1 |\n| Nearly bare and untilled (overland flow); and alluvial fans in western mountain regions | 0.2 | 0.051 | V=9.965(s)2-2 |\n| Cultivated straight row crops | 0.2 | 0.058 | V=8.762(s)2-2 |\n| Short-grass pasture | 0.2 | 0.073 | V=6.962(s)2-2 |\n| Minimum tillage cultivation, contour or strip-cropped, and woodlands | 0.2 | 0.101 | V=5.032(s)2-2 |\n| Forest with heavy ground litter and hay meadows | 0.2 | 0.202 | V=2.516(s)2-2 |\n\nSource context and notes:\n\n☐ When calculating the travel time for current storm events, use the precipitation depth for the current 2-year storm event, which is calculated by multiplying either the NOAA NWS PFDS rainfall depth or the NRCS county rainfall data for the 2-year storm by the current precipitation adjustment factors.\n\n☐ When calculating the travel time for projected storm events, use the precipitation depth of the projected 2-year storm event, which is calculated by multiplying either the NOAA NWS PFDS rainfall depth or the NRCS county rainfall data for the 2-year storm by the future precipitation change factors.\n\n- Calculating the travel time for a segment in which shallow concentrated flow occurs: Shallow concentrated flow occurs after sheet flow, and the depths range from 0.1 to 0.5 ft. The value for the flow velocity can be determined from the graphical source, reprinted as Figure 5-14 on the next page, is Figure 15-4 in NEH, Part 630, Chapter 15. This source was derived by solving Manning's equation for a wide variety of land covers; Figure 5-13 below is Table 15-3 in NEH, Part 630, Chapter 15, Equations and assumptions developed from figure 15-4. The velocities plotted in each are average values and are a function of watercourse slope and the cover condition of the channel. To use this figure, find the slope on the y-axis, noting it is a logarithmic in scale, and project a horizontal line over to the line which best fits the cover present for this segment of flow. Then draw a vertical line to the x-axis and read the velocity, taking note that the x-axis is also logarithmic in scale.\n\nFigure 5-13: Equations and assumptions from Figure 15-4 From NEH, Part 630, Chapter 15\n\n\n| Table 15-3 Equations and assumptions developed from figure 15-4 | | | |\n| --- | --- | --- | --- |\n| Flow type | Depth (ft) | Manning's n | Velocity equation (ft/s) |\n| Pavement and small upland gullies | 0.2 | 0.025 | V=20.328(s)1-1 |\n| Grassed waterways | 0.4 | 0.050 | V=16.135(s)1-1 |\n| Nearly bare and untilled (overland flow); and alluvial fans in western mountain regions | 0.2 | 0.051 | V=9.965(s)2-2 |\n| Cultivated straight row crops | 0.2 | 0.058 | V=8.762(s)2-2 |\n| Short-grass pasture | 0.2 | 0.073 | V=6.962(s)2-2 |\n| Minimum tillage cultivation, contour or strip-cropped, and woodlands | 0.2 | 0.101 | V=5.032(s)2-2 |\n| Forest with heavy ground litter and hay meadows | 0.2 | 0.202 | V=2.516(s)2-2 |\n\n\n\n[Source PDF](SOURCE.pdf#page=26)"}
{"metadata": {"source_document": "NJ BMP", "version_year": "2026", "chapter_subchapter": "Chapter 5", "citation": "BMP 2026, Ch 5, p. 34", "topic": "Table 12"}, "programmatic_checks": {}, "content_markdown": "# Stormwater Management Quantity and Quality Standards and Computations\n\n## Table 12\n\n| Example No. | Scenario Description | Page No. |\n| --- | --- | --- |\n| 5-1 | Calculate of Time of Concentration | 34 |\n| 5-2 | Use the NRCS CN Method for an Unconnected Impervious Surface to Calculate the Runoff Volume for a Site | 37 |\n| 5-3 | Use the NJDEP Two-Step Method for an Unconnected Impervious Surface to Calculate the Runoff Volume for a Site | 39 |\n| 5-4 | Demonstration of Why a Composite CN Generates an Incorrect Runoff Volume | 40 |\n| 5-5 | A Comparison of Pre- and Post-condition Hydrographs for Compliance Under N.J.A.C. 7:8-5.6(b)1 When Impervious Cover is Reduced | 42 |\n| 5-6 | A Re-development Project with Two Drainage Areas, Each Discharging to Separate Points, | 48 |\n| 5-7 | The Same Re-development Project with Two Drainage Areas, having One Combined Discharge Point | 69 |\n| 5-8 | A 2- Acre Development Project with GI BMPs Illustrating the Use of Current and Projected Storm Events in the Design Calculations to address the Water Quality, Runoff Quantity Control and Groundwater Recharge Requirements | 72 |\n| 5-9 | Calculate the Volume and Peak Flow Rate for the Runoff Produced by the WQDS Falling on 0.25 Acres of Regulated Motor Vehicle Surface to be Treated by a Manufactured Treatment Device | 84 |\n\nSource context and notes:\n\n# Stormwater Management Quantity and Quality Standards and Computations\n\nSource revision: January 2026.\n\n\n| Example No. | Scenario Description | Page No. |\n| --- | --- | --- |\n| 5-1 | Calculate of Time of Concentration | 34 |\n| 5-2 | Use the NRCS CN Method for an Unconnected Impervious Surface to Calculate the Runoff Volume for a Site | 37 |\n| 5-3 | Use the NJDEP Two-Step Method for an Unconnected Impervious Surface to Calculate the Runoff Volume for a Site | 39 |\n| 5-4 | Demonstration of Why a Composite CN Generates an Incorrect Runoff Volume | 40 |\n| 5-5 | A Comparison of Pre- and Post-condition Hydrographs for Compliance Under N.J.A.C. 7:8-5.6(b)1 When Impervious Cover is Reduced | 42 |\n| 5-6 | A Re-development Project with Two Drainage Areas, Each Discharging to Separate Points, | 48 |\n| 5-7 | The Same Re-development Project with Two Drainage Areas, having One Combined Discharge Point | 69 |\n| 5-8 | A 2- Acre Development Project with GI BMPs Illustrating the Use of Current and Projected Storm Events in the Design Calculations to address the Water Quality, Runoff Quantity Control and Groundwater Recharge Requirements | 72 |\n| 5-9 | Calculate the Volume and Peak Flow Rate for the Runoff Produced by the WQDS Falling on 0.25 Acres of Regulated Motor Vehicle Surface to be Treated by a Manufactured Treatment Device | 84 |\n\n\n## Example 5-1: Calculate Time of Concentration\n\nFor a site located in Mercer County, stormwater runoff flows through a wooded drainage area along a flow path, measuring 1,000 ft in length, consisting of sheet flow over an area with a 0.5% slope and shallow concentrated flow over an area of 1% slope. Calculate the time of concentration using current rainfall data.\n\n**Step 1:** In this example, there are only 2 different segments of flow. Travel time under sheet flow is calculated as follows:\n\n[Source PDF](SOURCE.pdf#page=34)"}
{"metadata": {"source_document": "NJ BMP", "version_year": "2026", "chapter_subchapter": "Chapter 5", "citation": "BMP 2026, Ch 5, p. 43", "topic": "Table 13"}, "programmatic_checks": {}, "content_markdown": "# Stormwater Management Quantity and Quality Standards and Computations\n\n## Table 13\n\n| Frequency of Storms | NOAA NWS PFDS Precipitation Depth (inches) | Current Precipitation Adjustment Factor | Current Rainfall Depth (inches) | Projected Precipitation Change Factor | Projected Rainfall Depth (inches) |\n| --- | --- | --- | --- | --- | --- |\n| 2-year | 3.33 | 1.01 | 3.36 | 1.16 | 3.86 |\n| 10-year | 4.99 | 1.02 | 5.09 | 1.17 | 5.83 |\n| 100-year | 8.15 | 1.04 | 8.48 | 1.36 | 11.08 |\n\nSource context and notes:\n\n# Stormwater Management Quantity and Quality Standards and Computations\n\nSource revision: January 2026.\n\n\n| Frequency of Storms | NOAA NWS PFDS Precipitation Depth (inches) | Current Precipitation Adjustment Factor | Current Rainfall Depth (inches) | Projected Precipitation Change Factor | Projected Rainfall Depth (inches) |\n| --- | --- | --- | --- | --- | --- |\n| 2-year | 3.33 | 1.01 | 3.36 | 1.16 | 3.86 |\n| 10-year | 4.99 | 1.02 | 5.09 | 1.17 | 5.83 |\n| 100-year | 8.15 | 1.04 | 8.48 | 1.36 | 11.08 |\n\n\n# Step 2: Calculate $\\mathsf{T}_{\\mathsf{c}}$ for the existing and proposed conditions.\n\nThe site conditions and 2-year current rainfall depth are entered into hydrologic modelling software. For pavement, the value for Manning's roughness coefficient is 0.011, as shown in Table 15-1, in NEH, Part 630, Chapter 15, and reprinted on Page 25. The pre-construction drainage pattern consists of sheet flow for the first 100 ft, followed by shallow concentrated flow for 200 ft. $T_{c}$ is calculated to be 3.2 minutes.\n\nThe post-construction drainage pattern remains the same as the existing condition, i.e., flowing from the north to the south. The slope, however, is increased from $1\\%$ to $5\\%$ . The time of concentration is calculated and shown in the table below. The sheet flow length calculated by McCuen-Spiess limitation criteria, where $S$ is the slope, in ft/ft, and $n$ is the Manning's roughness coefficient for sheet flow, is as follows:\n\n[Source PDF](SOURCE.pdf#page=43)"}
{"metadata": {"source_document": "NJ BMP", "version_year": "2026", "chapter_subchapter": "Chapter 5", "citation": "BMP 2026, Ch 5, p. 43", "topic": "Table 14"}, "programmatic_checks": {}, "content_markdown": "# Stormwater Management Quantity and Quality Standards and Computations\n\n## Table 14\n\n| Surface Description | Slope, S (ft/ft) | Manning's Roughness Coefficient, n, For Sheet Flow | McCuen-Spiess Limitation Sheet Flow Length (ft) | Sheet Flow Length to be used in the Model (ft) | Length of Shallow Concentrated Flow (ft) | Calculated Tc(min) for Current Rainfall Depth |\n| --- | --- | --- | --- | --- | --- | --- |\n| Building | 0.05 | 0.011 | 2,036 | 441 | 236 | 1.3 |\n| Landscaped Area | 0.05 | 0.150 | 149 | 1002 | 3453 | 10.3 |\n| Parking Area | 0.05 | 0.011 | 2,036 | 100 | 136 | 0.9 |\n\nSource context and notes:\n\nThe post-construction drainage pattern remains the same as the existing condition, i.e., flowing from the north to the south. The slope, however, is increased from $1\\%$ to $5\\%$ . The time of concentration is calculated and shown in the table below. The sheet flow length calculated by McCuen-Spiess limitation criteria, where $S$ is the slope, in ft/ft, and $n$ is the Manning's roughness coefficient for sheet flow, is as follows:\n\n$$\nL = \\frac {1 0 0 \\sqrt {S}}{n}\n$$\n\nand the calculated result exceeds 100 ft. Therefore, the sheet flow length must be limited to the maximum of 100 ft and the shallow concentrated flow length is 200 ft. However, the time of concentration for the building and parking area under the post-construction condition is shorter than the time of concentration for the pre-construction condition due to the increased slope.\n\n\n| Surface Description | Slope, S (ft/ft) | Manning's Roughness Coefficient, n, For Sheet Flow | McCuen-Spiess Limitation Sheet Flow Length (ft) | Sheet Flow Length to be used in the Model (ft) | Length of Shallow Concentrated Flow (ft) | Calculated Tc(min) for Current Rainfall Depth |\n| --- | --- | --- | --- | --- | --- | --- |\n| Building | 0.05 | 0.011 | 2,036 | 441 | 236 | 1.3 |\n| Landscaped Area | 0.05 | 0.150 | 149 | 1002 | 3453 | 10.3 |\n| Parking Area | 0.05 | 0.011 | 2,036 | 100 | 136 | 0.9 |\n\n\nSheet Flow Length is limited by the building width of 44 ft\n2 Sheet Flow Length = (100*sqrt(0.05))/0.150 = 149 ft; therefore, a maximum of 100 ft shall be used\n3 Shallow Concentrated Flow Length = The half of the lot width subtracted by the sheet flow length + the lot length = 290/2 - 100 + 300 = 345 ft\n\n[Source PDF](SOURCE.pdf#page=43)"}
{"metadata": {"source_document": "NJ BMP", "version_year": "2026", "chapter_subchapter": "Chapter 5", "citation": "BMP 2026, Ch 5, p. 44", "topic": "Table 15"}, "programmatic_checks": {}, "content_markdown": "# Stormwater Management Quantity and Quality Standards and Computations\n\n## Table 15\n\n| Projected 100-year Design Storm | | |\n| --- | --- | --- |\n| Parameter | Pre-Construction Condition | Post-Construction Condition |\n| Peak Flow Rate & Time of Peak = | 25.71 cfs @ 12.10 hr | 23.60 cfs @ 12.10 hr |\n| Runoff Volume= | 78,689.7 cf | 75,250.3 cf |\n\nSource context and notes:\n\n# Stormwater Management Quantity and Quality Standards and Computations\n\nSource revision: January 2026.\n\nStep 3: Calculate the peak flow rates for the projected 100-year storm for the pre- and post-construction conditions using the future precipitation change factor and compare the hydrographs.\n\nA summary of the results from the modelling software is shown in the table below:\n\n\n| Projected 100-year Design Storm | | |\n| --- | --- | --- |\n| Parameter | Pre-Construction Condition | Post-Construction Condition |\n| Peak Flow Rate & Time of Peak = | 25.71 cfs @ 12.10 hr | 23.60 cfs @ 12.10 hr |\n| Runoff Volume= | 78,689.7 cf | 75,250.3 cf |\n\n\nPre- and post-condition hydrographs for the projected 100-year storm, after applying the future precipitation change factor to the NOAA NWS PFDS rainfall data, are depicted below. The hydrographs were created by exporting the hydrograph tables as CSV data and then using a spreadsheet program to graph the information.\n\n[Figure: img-24.jpeg (original PDF, p. 44)](SOURCE.pdf#page=44)\n\n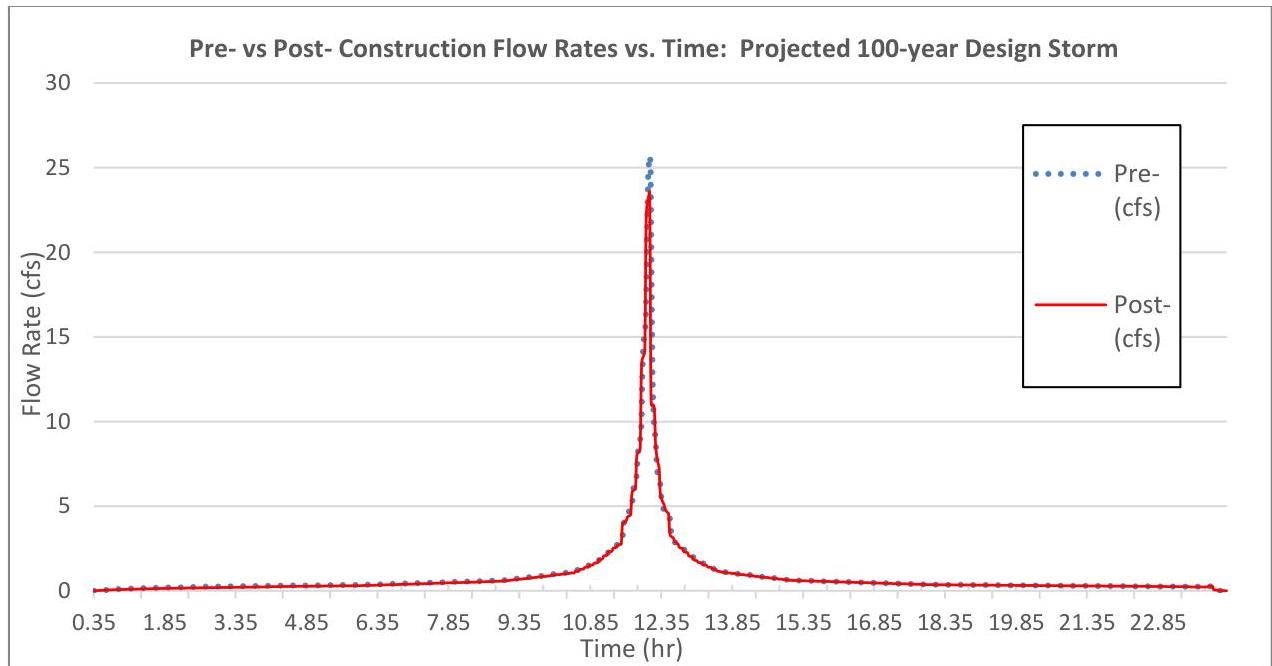\n\nAt first glance, one might assume the difference is negligible. However, the Rules do not permit any exceedance. If one were to zoom in on the previous hydrograph, e.g., starting at 11.92 hours, one would see the post-construction hydrograph has a higher flow rate than the pre-construction hydrograph in certain time periods. Some of these exceedances are highlighted in yellow in the following graphic.\n\n[Source PDF](SOURCE.pdf#page=44)\n\nOCR images on the cited PDF pages (page association only): [p. 44, image 1](images/page-0044-img-01.jpg)"}
{"metadata": {"source_document": "NJ BMP", "version_year": "2026", "chapter_subchapter": "Chapter 5", "citation": "BMP 2026, Ch 5, p. 45", "topic": "Table 16"}, "programmatic_checks": {}, "content_markdown": "# Stormwater Management Quantity and Quality Standards and Computations\n\n## Table 16\n\n| Time (hr) | Pre-construction (cfs) | Post-construction (cfs) | Difference in Flow Rate, Post - Pre, (cfs) |\n| --- | --- | --- | --- |\n| 11.91 | 9.04 | 9.86 | 0.82 |\n| 11.92 | 9.44 | 12.52 | 3.08 |\n| 11.93 | 10.42 | 13.39 | 2.97 |\n| 11.94 | 11.77 | 13.63 | 1.86 |\n| 11.95 | 13.07 | 13.73 | 0.66 |\n| 11.96 | 14.03 | 13.8 | -0.23 |\n| 11.97 | 14.63 | 13.87 | -0.76 |\n| 11.98 | 15 | 13.95 | -1.05 |\n| 11.99 | 15.22 | 14.03 | -1.19 |\n| 12 | 15.37 | 14.16 | -1.21 |\n| 12.01 | 15.53 | 16.59 | 1.06 |\n| 12.02 | 16.16 | 20.87 | 4.71 |\n| 12.03 | 17.74 | 22.30 | 4.56 |\n| 12.04 | 19.96 | 22.71 | 2.75 |\n| 12.05 | 22.05 | 22.90 | 0.85 |\n\nSource context and notes:\n\n# Stormwater Management Quantity and Quality Standards and Computations\n\nSource revision: January 2026.\n\n[Figure: img-25.jpeg (original PDF, p. 45)](SOURCE.pdf#page=45)\n\n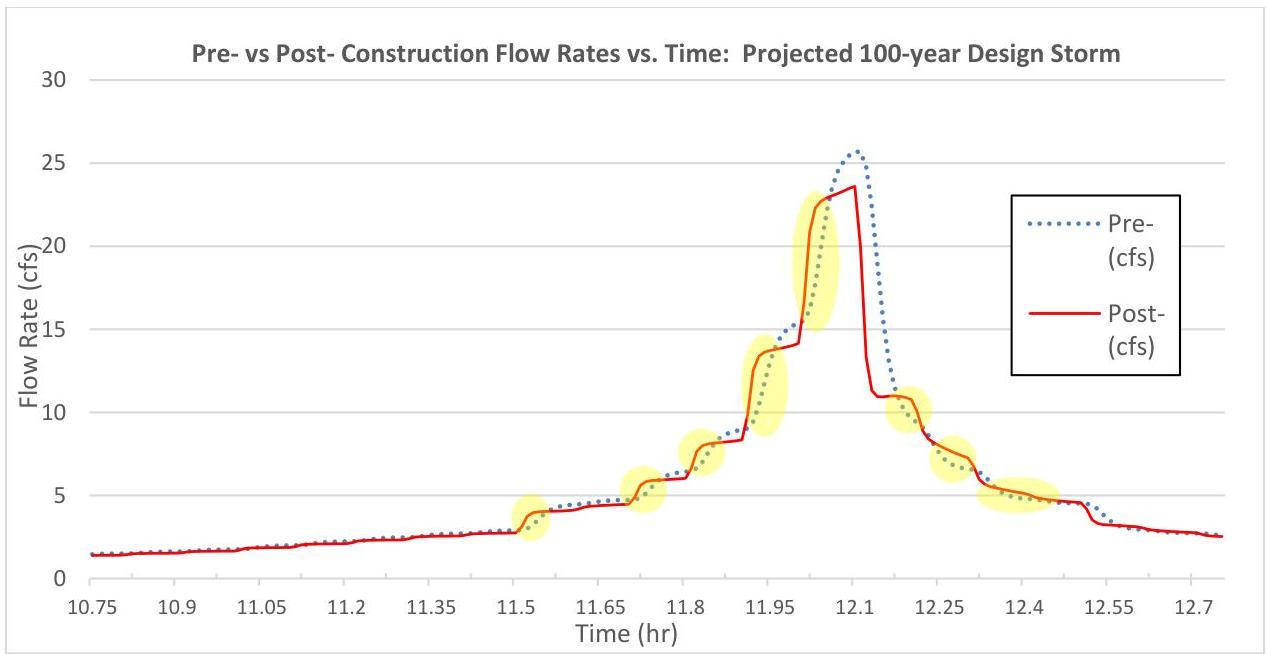\n\nA portion of the hydrograph data is also listed in the table below, for which the exceedances are highlighted in yellow. Take note this is just one example of two clusters of exceedances for this storm.\n\n\n| Time (hr) | Pre-construction (cfs) | Post-construction (cfs) | Difference in Flow Rate, Post - Pre, (cfs) |\n| --- | --- | --- | --- |\n| 11.91 | 9.04 | 9.86 | 0.82 |\n| 11.92 | 9.44 | 12.52 | 3.08 |\n| 11.93 | 10.42 | 13.39 | 2.97 |\n| 11.94 | 11.77 | 13.63 | 1.86 |\n| 11.95 | 13.07 | 13.73 | 0.66 |\n| 11.96 | 14.03 | 13.8 | -0.23 |\n| 11.97 | 14.63 | 13.87 | -0.76 |\n| 11.98 | 15 | 13.95 | -1.05 |\n| 11.99 | 15.22 | 14.03 | -1.19 |\n| 12 | 15.37 | 14.16 | -1.21 |\n| 12.01 | 15.53 | 16.59 | 1.06 |\n| 12.02 | 16.16 | 20.87 | 4.71 |\n| 12.03 | 17.74 | 22.30 | 4.56 |\n| 12.04 | 19.96 | 22.71 | 2.75 |\n| 12.05 | 22.05 | 22.90 | 0.85 |\n\n\nAlthough the reduction of impervious surface reduces the total volume of runoff and peak flow rate produced by the proposed construction, the design is not in compliance with N.J.A.C. 7:8-5.6(b)1, which requires that the post-construction runoff hydrographs do not exceed, at any point in time, the pre-construction runoff hydrographs for the same storm events, if the design engineer chooses to demonstrate the quantity control using this option. Since the hydrographs for the projected 100-year storm have already shown noncompliance, this example does not continue further to calculate\n\n[Source PDF](SOURCE.pdf#page=45)\n\nOCR images on the cited PDF pages (page association only): [p. 45, image 1](images/page-0045-img-01.jpg)"}
{"metadata": {"source_document": "NJ BMP", "version_year": "2026", "chapter_subchapter": "Chapter 5", "citation": "BMP 2026, Ch 5, p. 46", "topic": "Table 17"}, "programmatic_checks": {}, "content_markdown": "# Stormwater Management Quantity and Quality Standards and Computations\n\n## Table 17\n\n| | Projected 100-year Design Storm | | |\n| --- | --- | --- | --- |\n| | Pre-Construction Peak Flow Rate | Allowable Post-Construction (80% Reduction) Peak Flow Rate | Post-Construction Peak Flow Rate |\n| Peak Flow Rate = | 25.71 cfs | 20.57 cfs | 23.60 cfs |\n\nSource context and notes:\n\n# Stormwater Management Quantity and Quality Standards and Computations\n\nSource revision: January 2026.\n\nhydrographs for the projected 2- and 10-year storms. Additionally, a similar comparison for the 2-, 10- and 100-year design storms using rainfall data with the current precipitation adjustment factors applied would be required to demonstrate compliance for the current design storms.\n\nOn the other hand, if the design engineer chooses to demonstrate compliance with the quantity control requirements under N.J.A.C. 7:8-5.6(b)3, e.g., that the post-construction peak runoff rates for the projected 2-, 10- and 100-year storm events are 50, 75 and 80 percent, respectively, of the pre-construction peak runoff rates, the calculation of the peak flow rate for the projected 100-year storm will be as follows:\n\n\n| | Projected 100-year Design Storm | | |\n| --- | --- | --- | --- |\n| | Pre-Construction Peak Flow Rate | Allowable Post-Construction (80% Reduction) Peak Flow Rate | Post-Construction Peak Flow Rate |\n| Peak Flow Rate = | 25.71 cfs | 20.57 cfs | 23.60 cfs |\n\n\nThe projected 100-year post-construction peak flow rate, 23.60 cfs, exceeds the allowable flow rate, 20.57 cfs. Therefore, the project is still not in compliance with the stormwater runoff quantity control requirement under the option found in N.J.A.C. 7:8-5.6(b)3. A stormwater runoff quantity control or green infrastructure BMP will be required to reduce the projected 100-year post-construction peak flow to 80%, or lower, of the pre-construction peak flow rate.\n\n# Step 4: Calculate the peak flow rates for other design storms for the pre- and post-construction conditions and compare the hydrographs\n\nIn Step 3, the comparison of hydrographs for the pre- and post-construction projected 100-year design year storms has shown that a reduction of the impervious surface or runoff volume in a redevelopment project may not comply with N.J.A.C. 7:8-5.6(b). The rules require the demonstration of compliance with the requirements in N.J.A.C. 7:8-5.6(b) for the current and projected 2-, 10- and 100-year storms. Using the same technique in Step 3, a hydrograph comparison of the pre- and post- current 2-year storms, for example, is shown in the table below. To correctly calculate the time of concentration, first $P_{2}$ was calculated by multiplying the NOAA NWQ PFDS rainfall depth for the 2-year storm (3.33 in) with the current precipitation adjustment factor (1.01) and is equal to 3.36 in. Next, the modeling software is used to produce the hydrographs, with the peak flow rates and time intervals exported as data for input into a spreadsheet to create a chart. Here is the summary information.\n\n[Source PDF](SOURCE.pdf#page=46)"}
{"metadata": {"source_document": "NJ BMP", "version_year": "2026", "chapter_subchapter": "Chapter 5", "citation": "BMP 2026, Ch 5, p. 46", "topic": "Table 18"}, "programmatic_checks": {}, "content_markdown": "# Stormwater Management Quantity and Quality Standards and Computations\n\n## Table 18\n\n| Current 2-year Design Storm | | |\n| --- | --- | --- |\n| Parameter | Pre-Construction Condition | Post-Construction Condition |\n| Peak Flow Rate & Time of Peak = | 7.72 cfs @ 12.11 hr | 6.79 cfs @ 12.10 hr |\n| Runoff Volume= | 22,670 cf | 20,507 cf |\n\nSource context and notes:\n\n| Peak Flow Rate = | 25.71 cfs | 20.57 cfs | 23.60 cfs |\n\nThe projected 100-year post-construction peak flow rate, 23.60 cfs, exceeds the allowable flow rate, 20.57 cfs. Therefore, the project is still not in compliance with the stormwater runoff quantity control requirement under the option found in N.J.A.C. 7:8-5.6(b)3. A stormwater runoff quantity control or green infrastructure BMP will be required to reduce the projected 100-year post-construction peak flow to 80%, or lower, of the pre-construction peak flow rate.\n\n# Step 4: Calculate the peak flow rates for other design storms for the pre- and post-construction conditions and compare the hydrographs\n\nIn Step 3, the comparison of hydrographs for the pre- and post-construction projected 100-year design year storms has shown that a reduction of the impervious surface or runoff volume in a redevelopment project may not comply with N.J.A.C. 7:8-5.6(b). The rules require the demonstration of compliance with the requirements in N.J.A.C. 7:8-5.6(b) for the current and projected 2-, 10- and 100-year storms. Using the same technique in Step 3, a hydrograph comparison of the pre- and post- current 2-year storms, for example, is shown in the table below. To correctly calculate the time of concentration, first $P_{2}$ was calculated by multiplying the NOAA NWQ PFDS rainfall depth for the 2-year storm (3.33 in) with the current precipitation adjustment factor (1.01) and is equal to 3.36 in. Next, the modeling software is used to produce the hydrographs, with the peak flow rates and time intervals exported as data for input into a spreadsheet to create a chart. Here is the summary information.\n\n\n| Current 2-year Design Storm | | |\n| --- | --- | --- |\n| Parameter | Pre-Construction Condition | Post-Construction Condition |\n| Peak Flow Rate & Time of Peak = | 7.72 cfs @ 12.11 hr | 6.79 cfs @ 12.10 hr |\n| Runoff Volume= | 22,670 cf | 20,507 cf |\n\n\nPre- and post-condition hydrographs are provided in the chart below. As with those for the projected 100-year storm from Step 3, they appear to be nearly identical.\n\n[Source PDF](SOURCE.pdf#page=46)"}
{"metadata": {"source_document": "NJ BMP", "version_year": "2026", "chapter_subchapter": "Chapter 5", "citation": "BMP 2026, Ch 5, p. 49", "topic": "Table 19"}, "programmatic_checks": {}, "content_markdown": "# Stormwater Management Quantity and Quality Standards and Computations\n\n## Table 19\n\n| Pre-construction Drainage Area Name (cover condition or undisturbed) | Area (ac) | CN | Tc(min) | Pre-construction Design Storm Flow Rate (cfs) | | |\n| --- | --- | --- | --- | --- | --- | --- |\n| | | | | 2-year | 10-year | 100-year |\n| Pre-A1 (pasture) | 0.25 | 61 | 17.4 | 0.07 | 0.30 | 0.88 |\n| Pre-A2 (undisturbed) | 0.75 | 61 | 24.2 | 0.19 | 0.78 | 2.26 |\n| Total Pre-A (Hydrograph addition) | 1.00 | | | 0.26 | 1.05 | 3.07 |\n| Pre-B1 (warehouse) | 0.50 | 98 | 2.8 | 1.76 | 2.81 | 4.80 |\n| Pre-B2 (woods/grass) | 0.25 | 70 | 18.6 | 0.17 | 0.45 | 1.07 |\n| Total Pre-B (Hydrograph addition) | 0.75 | | | 1.83 | 3.03 | 5.37 |\n\nSource context and notes:\n\n\nStep 2: Stormwater Runoff Quantity Standards:\n\nFor a major development project, stormwater runoff quantity control is required. The option to demonstrate compliance with N.J.A.C. 7:8-5.6(b)3 is chosen. The peak flow rates for pre-construction condition are calculated as follows:\n\n- CN values for the pre-construction condition are chosen based on the land cover having the least runoff potential and assuming good condition rather than fair or poor. The asphalt parking lot cannot be considered to be impervious surface since it has been removed and vegetation has been re-established.\n- The time of concentration is calculated by using a flow path of sheet flow computed by McCuen-Spiess limitation, plus a segment of shallow concentrated flow based the land cover specified above for the drainage area. The 2-, 10- and 100- year design storms produce rainfall depths, in Ocean County, of 3.4, 5.4 and 9.2 inches, respectively. For this example, the existing condition has two points of analysis: POA-A and POA-B. The times of concentration, volumes and peak flow rates from impervious surfaces and pervious surfaces must be calculated separately and the results are shown in the table below. When subdrainage areas have different times of concentration, the combined flow rate cannot be the sum of the peak flow rates for each of the subdrainage areas. In such an instance, the hydrographs for each of the subdrainage areas must be added, and then the peak flow rate is obtained from the results.\n\n\n| Pre-construction Drainage Area Name (cover condition or undisturbed) | Area (ac) | CN | Tc(min) | Pre-construction Design Storm Flow Rate (cfs) | | |\n| --- | --- | --- | --- | --- | --- | --- |\n| | | | | 2-year | 10-year | 100-year |\n| Pre-A1 (pasture) | 0.25 | 61 | 17.4 | 0.07 | 0.30 | 0.88 |\n| Pre-A2 (undisturbed) | 0.75 | 61 | 24.2 | 0.19 | 0.78 | 2.26 |\n| Total Pre-A (Hydrograph addition) | 1.00 | | | 0.26 | 1.05 | 3.07 |\n| Pre-B1 (warehouse) | 0.50 | 98 | 2.8 | 1.76 | 2.81 | 4.80 |\n| Pre-B2 (woods/grass) | 0.25 | 70 | 18.6 | 0.17 | 0.45 | 1.07 |\n| Total Pre-B (Hydrograph addition) | 0.75 | | | 1.83 | 3.03 | 5.37 |\n\n\n- Allowable post-construction peak flow under N.J.A.C. 7:8-5.6(b)3:\n\nUnder N.J.A.C. 7:8-5.6(b)3, the post-construction condition peak flow rates must be reduced to 50%, 75% and 80% of the pre-construction peak flow rates, respectively. It is also stated in the rules that the percentages apply only to the post-construction stormwater runoff that is attributable to the portion of the site on which the proposed development or project is to be constructed. Therefore, the reduction percentages are not required for the undisturbed drainage area, Pre-A2. The allowable peak flow rates are listed below.\n\n[Source PDF](SOURCE.pdf#page=49)"}
{"metadata": {"source_document": "NJ BMP", "version_year": "2026", "chapter_subchapter": "Chapter 5", "citation": "BMP 2026, Ch 5, p. 50", "topic": "Table 20"}, "programmatic_checks": {}, "content_markdown": "# Stormwater Management Quantity and Quality Standards and Computations\n\n## Table 20\n\n| Pre-construction Drainage Area Name (cover condition) | Area (ac) | Allowable Design Storm Peak Flow Rates (cfs) | | |\n| --- | --- | --- | --- | --- |\n| | | 2-year | 10-year | 100-year |\n| Pre-A1 (pasture) | 0.25 | 0.04 | 0.23 | 0.70 |\n| Pre-A2 (undisturbed) | 0.75 | 0.19 | 0.78 | 2.26 |\n| Total Pre-A | 1.00 | 0.23 | 1.01 | 2.96 |\n| Pre-B1 (warehouse) | 0.50 | 0.88 | 2.11 | 3.84 |\n| Pre-B2 (woods/grass) | 0.25 | 0.09 | 0.34 | 0.86 |\n| Total Pre-B | 0.75 | 0.92 | 2.27 | 4.30 |\n\nSource context and notes:\n\n# Stormwater Management Quantity and Quality Standards and Computations\n\nSource revision: January 2026.\n\n\n| Pre-construction Drainage Area Name (cover condition) | Area (ac) | Allowable Design Storm Peak Flow Rates (cfs) | | |\n| --- | --- | --- | --- | --- |\n| | | 2-year | 10-year | 100-year |\n| Pre-A1 (pasture) | 0.25 | 0.04 | 0.23 | 0.70 |\n| Pre-A2 (undisturbed) | 0.75 | 0.19 | 0.78 | 2.26 |\n| Total Pre-A | 1.00 | 0.23 | 1.01 | 2.96 |\n| Pre-B1 (warehouse) | 0.50 | 0.88 | 2.11 | 3.84 |\n| Pre-B2 (woods/grass) | 0.25 | 0.09 | 0.34 | 0.86 |\n| Total Pre-B | 0.75 | 0.92 | 2.27 | 4.30 |\n\n\nThe post-construction peak flow rates for each of the proposed drainage areas (prior to the incorporation of stormwater management measures) are shown below:\n\n| Post-construction Drainage Area Name (undisturbed/cover condition) | Area (ac) | CN | Tc(min) | Post-construction Design Storm Flow Rate (cfs) | | |\n| --- | --- | --- | --- | --- | --- | --- |\n| | | | | 2-year | 10-year | 100-year |\n| Post-A1 (parking/ gravel) | 0.25 | 96 | 3.5 | 0.83 | 1.35 | 2.33 |\n| Post-A2 (undisturbed/pasture) | 0.75 | 61 | 24.2 | 0.19 | 0.78 | 2.26 |\n| Total Post-A (Hydrograph addition) | 1.00 | | | 0.85 | 1.62 | 3.31 |\n| Post-B1 (building or walkway) | 0.16 | 98 | 1.6 | 0.57 | 0.90 | 1.54 |\n| Post-B2 (open space/grass 50% to 75%) | 0.59 | 79 | 8.9 | 0.90 | 1.91 | 3.93 |\n| Total Post-B (Hydrograph addition) | 0.75 | | | 1.24 | 2.41 | 4.74 |\n\n☐ The uncontrolled post-construction peak flow rates generated by drainage area Post-A exceed the allowable design storm peak flow rates of stormwater runoff generated by drainage area Pre-A. Therefore, green infrastructure BMPs listed in Table 5-1 or 5-2, as required by N.J.A.C. 7:8-5.3(c), must be used to meet the stormwater runoff quantity control requirements. As stated on Page 48, a small-scale infiltration basin is proposed to provide the stormwater runoff quantity control.\n\n[Source PDF](SOURCE.pdf#page=50)"}
{"metadata": {"source_document": "NJ BMP", "version_year": "2026", "chapter_subchapter": "Chapter 5", "citation": "BMP 2026, Ch 5, p. 50", "topic": "Table 21"}, "programmatic_checks": {}, "content_markdown": "# Stormwater Management Quantity and Quality Standards and Computations\n\n## Table 21\n\n| Post-construction Drainage Area Name (undisturbed/cover condition) | Area (ac) | CN | Tc(min) | Post-construction Design Storm Flow Rate (cfs) | | |\n| --- | --- | --- | --- | --- | --- | --- |\n| | | | | 2-year | 10-year | 100-year |\n| Post-A1 (parking/ gravel) | 0.25 | 96 | 3.5 | 0.83 | 1.35 | 2.33 |\n| Post-A2 (undisturbed/pasture) | 0.75 | 61 | 24.2 | 0.19 | 0.78 | 2.26 |\n| Total Post-A (Hydrograph addition) | 1.00 | | | 0.85 | 1.62 | 3.31 |\n| Post-B1 (building or walkway) | 0.16 | 98 | 1.6 | 0.57 | 0.90 | 1.54 |\n| Post-B2 (open space/grass 50% to 75%) | 0.59 | 79 | 8.9 | 0.90 | 1.91 | 3.93 |\n| Total Post-B (Hydrograph addition) | 0.75 | | | 1.24 | 2.41 | 4.74 |\n\nSource context and notes:\n\n| Pre-A2 (undisturbed) | 0.75 | 0.19 | 0.78 | 2.26 |\n| Total Pre-A | 1.00 | 0.23 | 1.01 | 2.96 |\n| Pre-B1 (warehouse) | 0.50 | 0.88 | 2.11 | 3.84 |\n| Pre-B2 (woods/grass) | 0.25 | 0.09 | 0.34 | 0.86 |\n| Total Pre-B | 0.75 | 0.92 | 2.27 | 4.30 |\n\nThe post-construction peak flow rates for each of the proposed drainage areas (prior to the incorporation of stormwater management measures) are shown below:\n\n\n| Post-construction Drainage Area Name (undisturbed/cover condition) | Area (ac) | CN | Tc(min) | Post-construction Design Storm Flow Rate (cfs) | | |\n| --- | --- | --- | --- | --- | --- | --- |\n| | | | | 2-year | 10-year | 100-year |\n| Post-A1 (parking/ gravel) | 0.25 | 96 | 3.5 | 0.83 | 1.35 | 2.33 |\n| Post-A2 (undisturbed/pasture) | 0.75 | 61 | 24.2 | 0.19 | 0.78 | 2.26 |\n| Total Post-A (Hydrograph addition) | 1.00 | | | 0.85 | 1.62 | 3.31 |\n| Post-B1 (building or walkway) | 0.16 | 98 | 1.6 | 0.57 | 0.90 | 1.54 |\n| Post-B2 (open space/grass 50% to 75%) | 0.59 | 79 | 8.9 | 0.90 | 1.91 | 3.93 |\n| Total Post-B (Hydrograph addition) | 0.75 | | | 1.24 | 2.41 | 4.74 |\n\n\n☐ The uncontrolled post-construction peak flow rates generated by drainage area Post-A exceed the allowable design storm peak flow rates of stormwater runoff generated by drainage area Pre-A. Therefore, green infrastructure BMPs listed in Table 5-1 or 5-2, as required by N.J.A.C. 7:8-5.3(c), must be used to meet the stormwater runoff quantity control requirements. As stated on Page 48, a small-scale infiltration basin is proposed to provide the stormwater runoff quantity control.\n\n☐ Similarly, for drainage area B, the uncontrolled post-construction peak flow rates of stormwater runoff generated by drainage area Post-B exceed the allowable design storm peak flow rates of stormwater runoff generated by drainage area Pre-B. Therefore, green infrastructure BMPs listed in Table 5-1 or 5-2 must also be used to meet the stormwater runoff quantity control requirements.\n\n[Source PDF](SOURCE.pdf#page=50)"}
{"metadata": {"source_document": "NJ BMP", "version_year": "2026", "chapter_subchapter": "Chapter 5", "citation": "BMP 2026, Ch 5, p. 51", "topic": "Table 22"}, "programmatic_checks": {}, "content_markdown": "# Stormwater Management Quantity and Quality Standards and Computations\n\n## Table 22\n\n| Inflow Area = 10,890 sf, 0.00% Impervious, Inflow Depth = 2.95\" for 2-Year event | | | | |\n| --- | --- | --- | --- | --- |\n| Inflow = 0.83 cfs @ 12.09 hrs, Volume= 2,674 cf | | | | |\n| Outflow = 0.12 cfs @ 12.57 hrs, Volume= 2,674 cf, Atten= 85%, Lag= 28.8 min | | | | |\n| Discarded = 0.09 cfs @ 11.60 hrs, Volume= 2,532 cf | | | | |\n| Primary = 0.03 cfs @ 12.57 hrs, Volume= 142 cf | | | | |\n| Routing by Stor-Ind method, Time Span= 0.00-48.00 hrs, dt= 0.05 hrs | | | | |\n| Peak Elev= 0.29' @ 12.57 hrs Surf.Area= 2,700 sf Storage= 777 cf | | | | |\n| Plug-Flow detention time= 51.7 min calculated for 2,674 cf (100% of inflow) | | | | |\n| Center-of-Mass det. time= 51.6 min (825.1 - 773.5) | | | | |\n| Volume Invert Avail.Storage Storage Description | | | | |\n| #1 0.00' 8,100 cf Custom Stage Data (Prismatic) Listed below (Recalc) | | | | |\n| Elevation Surf.Area Inc.Store Cumulative | | | | |\n| (feet) (sq-ft) (cubic-feet) (cubic-feet) | | | | |\n| 0.00 | 2,700 | 0 | 0 | |\n| 1.00 | 2,700 | 2,700 | 2,700 | |\n| 2.00 | 2,700 | 2,700 | 5,400 | |\n| 3.00 | 2,700 | 2,700 | 8,100 | |\n| Device Routing Invert Outlet Devices | | | | |\n| #1 Primary 1.00' 20.0' long x 0.5' breadth Broad-Crested Rectangular Weir | | | | |\n| Head (feet) 0.20 0.40 0.60 0.80 1.00 | | | | |\n| Coef. (English) 2.80 2.92 3.08 3.30 3.32 | | | | |\n| #2 Primary 0.15' 2.5\" Vert. Orifice/Grate C= 0.600 | | | | |\n| #3 Discarded 0.00' 1.50 in/hr Exfiltration over Surface area | | | | |\n| Discarded OutFlow Max=0.09 cfs @ 11.60 hrs HW=0.03' (Free Discharge) | | | | |\n| ←3=Exfiltration (Exfiltration Controls 0.09 cfs) | | | | |\n| Primary OutFlow Max=0.03 cfs @ 12.57 hrs HW=0.29' (Free Discharge) | | | | |\n| ←1=Broad-Crested Rectangular Weir (Controls 0.00 cfs) | | | | |\n| ←2=Orifice/Grate (Orifice Controls 0.03 cfs @ 1.26 fps) | | | | |\n\nSource context and notes:\n\nSource revision: January 2026.\n\n# Step 3: Calculate the Post-Construction Design Storm Peak Flow Rates for Drainage Area Post-A-1\n\nThe proposed small-scale infiltration basin has a 2,700 sf bottom footprint and a basin depth of 2 ft, plus 1 ft of freeboard. The 4-sided concrete outlet structure includes a 2.5 in orifice located 0.15 ft above the basin bottom and a top grate, which acts as a broad-crested weir, located 1 ft above the basin bottom. The weir opening is 20 ft long = 4 sides x 5 ft per side, and the depth of the weir, i.e., the outlet structure wall thickness, is 0.5 ft. Exfiltration is included in the routing calculation, using the design permeability rate of 1.5 in/hr, which is one-half of the tested permeability rate of 3 in/hr. Take note that the exfiltration can be credited only on the infiltration area, which is the footprint of the BMP. The side slopes of the BMP cannot be used for exfiltration. Therefore, the routing, with exfiltration, must only use the design permeability rate of the most restrictive soil layer under the BMP and the footprint, i.e., the exfiltration area, of the BMP to determine the maximum exfiltration flow rate (cfs) in the BMP. In the current case, however, the BMP has the same surface area 2,700 sf from the bottom to the top. A constant exfiltration flow rate, 0.09375 cfs (2,700 sf x 1.5 in/hr x 1/12 in/ft x 1/3600 second/hr), in the routing or a constant exfiltration rate 1.5 in/hr is applied to 2,700 sf for all water elevations in the routing. The results obtained from HydroCAD® are each shown on the following pages for the 2-, 10- and 100-year design storms. A designer may use other hydrologic - hydraulic modeling software to perform the routing calculations.\n\n## 2-year Design Storm Post-Construction Condition Summary Report\n\n\n| Inflow Area = 10,890 sf, 0.00% Impervious, Inflow Depth = 2.95\" for 2-Year event | | | | |\n| --- | --- | --- | --- | --- |\n| Inflow = 0.83 cfs @ 12.09 hrs, Volume= 2,674 cf | | | | |\n| Outflow = 0.12 cfs @ 12.57 hrs, Volume= 2,674 cf, Atten= 85%, Lag= 28.8 min | | | | |\n| Discarded = 0.09 cfs @ 11.60 hrs, Volume= 2,532 cf | | | | |\n| Primary = 0.03 cfs @ 12.57 hrs, Volume= 142 cf | | | | |\n| Routing by Stor-Ind method, Time Span= 0.00-48.00 hrs, dt= 0.05 hrs | | | | |\n| Peak Elev= 0.29' @ 12.57 hrs Surf.Area= 2,700 sf Storage= 777 cf | | | | |\n| Plug-Flow detention time= 51.7 min calculated for 2,674 cf (100% of inflow) | | | | |\n| Center-of-Mass det. time= 51.6 min (825.1 - 773.5) | | | | |\n| Volume Invert Avail.Storage Storage Description | | | | |\n| #1 0.00' 8,100 cf Custom Stage Data (Prismatic) Listed below (Recalc) | | | | |\n| Elevation Surf.Area Inc.Store Cumulative | | | | |\n| (feet) (sq-ft) (cubic-feet) (cubic-feet) | | | | |\n| 0.00 | 2,700 | 0 | 0 | |\n| 1.00 | 2,700 | 2,700 | 2,700 | |\n| 2.00 | 2,700 | 2,700 | 5,400 | |\n| 3.00 | 2,700 | 2,700 | 8,100 | |\n| Device Routing Invert Outlet Devices | | | | |\n| #1 Primary 1.00' 20.0' long x 0.5' breadth Broad-Crested Rectangular Weir | | | | |\n| Head (feet) 0.20 0.40 0.60 0.80 1.00 | | | | |\n| Coef. (English) 2.80 2.92 3.08 3.30 3.32 | | | | |\n| #2 Primary 0.15' 2.5\" Vert. Orifice/Grate C= 0.600 | | | | |\n| #3 Discarded 0.00' 1.50 in/hr Exfiltration over Surface area | | | | |\n| Discarded OutFlow Max=0.09 cfs @ 11.60 hrs HW=0.03' (Free Discharge) | | | | |\n| ←3=Exfiltration (Exfiltration Controls 0.09 cfs) | | | | |\n| Primary OutFlow Max=0.03 cfs @ 12.57 hrs HW=0.29' (Free Discharge) | | | | |\n| ←1=Broad-Crested Rectangular Weir (Controls 0.00 cfs) | | | | |\n| ←2=Orifice/Grate (Orifice Controls 0.03 cfs @ 1.26 fps) | | | | |\n\n\nSource: HydroCAD® Summary Report; HydroCAD is a registered trademark of HydroCAD Software Solutions LLC. Used with permission.\n\n[Source PDF](SOURCE.pdf#page=51)"}
{"metadata": {"source_document": "NJ BMP", "version_year": "2026", "chapter_subchapter": "Chapter 5", "citation": "BMP 2026, Ch 5, p. 52", "topic": "Table 23"}, "programmatic_checks": {}, "content_markdown": "# Stormwater Management Quantity and Quality Standards and Computations\n\n## Table 23\n\n| Inflow Area = 10,890 sf, 0.00% Impervious, Inflow Depth = 4.93\" for 10-Year event | | | | |\n| --- | --- | --- | --- | --- |\n| Inflow = 1.35 cfs @ 12.09 hrs, Volume= 4,474 cf | | | | |\n| Outflow = 0.18 cfs @ 12.62 hrs, Volume= 4,474 cf, Atten= 87%, Lag= 31.7 min | | | | |\n| Discarded = 0.09 cfs @ 11.10 hrs, Volume= 3,672 cf | | | | |\n| Primary = 0.09 cfs @ 12.62 hrs, Volume= 802 cf | | | | |\n| Routing by Stor-Ind method, Time Span= 0.00-48.00 hrs, dt= 0.05 hrs | | | | |\n| Peak Elev= 0.54' @ 12.62 hrs Surf.Area= 2,700 sf Storage= 1,451 cf | | | | |\n| Plug-Flow detention time= 72.0 min calculated for 4,470 cf (100% of inflow) | | | | |\n| Center-of-Mass det. time= 72.0 min (832.6 - 760.6) | | | | |\n| Volume | Invert | Avail.Storage | Storage Description | |\n| #1 | 0.00' | 8,100 cf | Custom Stage Data (Prismatic) Listed below (Recalc) | |\n| Elevation (feet) | Surf.Area (sq-ft) | Inc.Store (cubic-feet) | Cum.Store (cubic-feet) | |\n| 0.00 | 2,700 | 0 | 0 | |\n| 1.00 | 2,700 | 2,700 | 2,700 | |\n| 2.00 | 2,700 | 2,700 | 5,400 | |\n| 3.00 | 2,700 | 2,700 | 8,100 | |\n| Device | Routing | Invert | Outlet Devices | |\n| #1 | Primary | 1.00' | 20.0' long x 0.5' breadth Broad-Crested Rectangular Weir
Head (feet) 0.20 0.40 0.60 0.80 1.00
Coef. (English) 2.80 2.92 3.08 3.30 3.32 | |\n| #2 | Primary | 0.15' | 2.5\" Vert. Orifice/Grate C= 0.600 | |\n| #3 | Discarded | 0.00' | 1.50 in/hr Exfiltration over Surface area | |\n| Discarded OutFlow Max=0.09 cfs @ 11.10 hrs HW=0.03' (Free Discharge)
3=Exfiltration (Exfiltration Controls 0.09 cfs) | | | | |\n| Primary OutFlow Max=0.09 cfs @ 12.62 hrs HW=0.54' (Free Discharge)
1=Broad-Crested Rectangular Weir (Controls 0.00 cfs)
2=Orifice/Grate (Orifice Controls 0.09 cfs @ 2.56 fps) | | | | |\n\nSource context and notes:\n\n# Stormwater Management Quantity and Quality Standards and Computations\n\nSource revision: January 2026.\n\n# 10-year Design Storm Post-Construction Condition Summary Report\n\n\n| Inflow Area = 10,890 sf, 0.00% Impervious, Inflow Depth = 4.93\" for 10-Year event | | | | |\n| --- | --- | --- | --- | --- |\n| Inflow = 1.35 cfs @ 12.09 hrs, Volume= 4,474 cf | | | | |\n| Outflow = 0.18 cfs @ 12.62 hrs, Volume= 4,474 cf, Atten= 87%, Lag= 31.7 min | | | | |\n| Discarded = 0.09 cfs @ 11.10 hrs, Volume= 3,672 cf | | | | |\n| Primary = 0.09 cfs @ 12.62 hrs, Volume= 802 cf | | | | |\n| Routing by Stor-Ind method, Time Span= 0.00-48.00 hrs, dt= 0.05 hrs | | | | |\n| Peak Elev= 0.54' @ 12.62 hrs Surf.Area= 2,700 sf Storage= 1,451 cf | | | | |\n| Plug-Flow detention time= 72.0 min calculated for 4,470 cf (100% of inflow) | | | | |\n| Center-of-Mass det. time= 72.0 min (832.6 - 760.6) | | | | |\n| Volume | Invert | Avail.Storage | Storage Description | |\n| #1 | 0.00' | 8,100 cf | Custom Stage Data (Prismatic) Listed below (Recalc) | |\n| Elevation (feet) | Surf.Area (sq-ft) | Inc.Store (cubic-feet) | Cum.Store (cubic-feet) | |\n| 0.00 | 2,700 | 0 | 0 | |\n| 1.00 | 2,700 | 2,700 | 2,700 | |\n| 2.00 | 2,700 | 2,700 | 5,400 | |\n| 3.00 | 2,700 | 2,700 | 8,100 | |\n| Device | Routing | Invert | Outlet Devices | |\n| #1 | Primary | 1.00' | 20.0' long x 0.5' breadth Broad-Crested Rectangular Weir
Head (feet) 0.20 0.40 0.60 0.80 1.00
Coef. (English) 2.80 2.92 3.08 3.30 3.32 | |\n| #2 | Primary | 0.15' | 2.5\" Vert. Orifice/Grate C= 0.600 | |\n| #3 | Discarded | 0.00' | 1.50 in/hr Exfiltration over Surface area | |\n| Discarded OutFlow Max=0.09 cfs @ 11.10 hrs HW=0.03' (Free Discharge)
3=Exfiltration (Exfiltration Controls 0.09 cfs) | | | | |\n| Primary OutFlow Max=0.09 cfs @ 12.62 hrs HW=0.54' (Free Discharge)
1=Broad-Crested Rectangular Weir (Controls 0.00 cfs)
2=Orifice/Grate (Orifice Controls 0.09 cfs @ 2.56 fps) | | | | |\n\n\nSource: HydroCAD® Summary Report; HydroCAD is a registered trademark of HydroCAD Software Solutions LLC. Used with permission.\n\n[Source PDF](SOURCE.pdf#page=52)"}
{"metadata": {"source_document": "NJ BMP", "version_year": "2026", "chapter_subchapter": "Chapter 5", "citation": "BMP 2026, Ch 5, p. 53", "topic": "Table 24"}, "programmatic_checks": {}, "content_markdown": "# Stormwater Management Quantity and Quality Standards and Computations\n\n## Table 24\n\n| Inflow Area = 10,890 sf, 0.00% Impervious, Inflow Depth = 8.72\" for 100-Year event | | | | |\n| --- | --- | --- | --- | --- |\n| Inflow = 2.33 cfs @ 12.09 hrs, Volume= 7,912 cf | | | | |\n| Outflow = 0.45 cfs @ 12.42 hrs, Volume= 7,912 cf, Atten= 81%, Lag= 19.7 min | | | | |\n| Discarded = 0.09 cfs @ 10.00 hrs, Volume= 5,296 cf | | | | |\n| Primary = 0.36 cfs @ 12.42 hrs, Volume= 2,616 cf | | | | |\n| Routing by Stor-Ind method, Time Span= 0.00-48.00 hrs, dt= 0.05 hrs | | | | |\n| Peak Elev= 1.02' @ 12.40 hrs Surf.Area= 2,700 sf Storage= 2,762 cf | | | | |\n| Plug-Flow detention time= 103.3 min calculated for 7,904 cf (100% of inflow) | | | | |\n| Center-of-Mass det. time= 103.2 min (852.1 - 748.9) | | | | |\n| Volume | Invert | Avail.Storage | Storage Description | |\n| #1 | 0.00' | 8,100 cf | Custom Stage Data (Prismatic) Listed below (Recalc) | |\n| Elevation (feet) | Surf.Area (sq-ft) | Inc.Store (cubic-feet) | Cum.Store (cubic-feet) | |\n| 0.00 | 2,700 | 0 | 0 | |\n| 1.00 | 2,700 | 2,700 | 2,700 | |\n| 2.00 | 2,700 | 2,700 | 5,400 | |\n| 3.00 | 2,700 | 2,700 | 8,100 | |\n| Device | Routing | Invert | Outlet Devices | |\n| #1 | Primary | 1.00' | 20.0' long x 0.5' breadth Broad-Crested Rectangular Weir Head (feet) 0.20 0.40 0.60 0.80 1.00 Coef. (English) 2.80 2.92 3.08 3.30 3.32 | |\n| #2 | Primary | 0.15' | 2.5\" Vert. Orifice/Grate C= 0.600 | |\n| #3 | Discarded | 0.00' | 1.50 in/hr Exfiltration over Surface area | |\n| Discarded OutFlow Max=0.09 cfs @ 10.00 hrs HW=0.03' (Free Discharge) -3=Exfiltration (Exfiltration Controls 0.09 cfs) | | | | |\n| Primary OutFlow Max=0.34 cfs @ 12.42 hrs HW=1.02' (Free Discharge) -1=Broad-Crested Rectangular Weir (Weir Controls 0.20 cfs @ 0.43 fps) -2=Orifice/Grate (Orifice Controls 0.14 cfs @ 4.22 fps) | | | | |\n\nSource context and notes:\n\n# Stormwater Management Quantity and Quality Standards and Computations\n\nSource revision: January 2026.\n\n# 100-year Design Storm Post-Construction Condition Summary Report\n\n\n| Inflow Area = 10,890 sf, 0.00% Impervious, Inflow Depth = 8.72\" for 100-Year event | | | | |\n| --- | --- | --- | --- | --- |\n| Inflow = 2.33 cfs @ 12.09 hrs, Volume= 7,912 cf | | | | |\n| Outflow = 0.45 cfs @ 12.42 hrs, Volume= 7,912 cf, Atten= 81%, Lag= 19.7 min | | | | |\n| Discarded = 0.09 cfs @ 10.00 hrs, Volume= 5,296 cf | | | | |\n| Primary = 0.36 cfs @ 12.42 hrs, Volume= 2,616 cf | | | | |\n| Routing by Stor-Ind method, Time Span= 0.00-48.00 hrs, dt= 0.05 hrs | | | | |\n| Peak Elev= 1.02' @ 12.40 hrs Surf.Area= 2,700 sf Storage= 2,762 cf | | | | |\n| Plug-Flow detention time= 103.3 min calculated for 7,904 cf (100% of inflow) | | | | |\n| Center-of-Mass det. time= 103.2 min (852.1 - 748.9) | | | | |\n| Volume | Invert | Avail.Storage | Storage Description | |\n| #1 | 0.00' | 8,100 cf | Custom Stage Data (Prismatic) Listed below (Recalc) | |\n| Elevation (feet) | Surf.Area (sq-ft) | Inc.Store (cubic-feet) | Cum.Store (cubic-feet) | |\n| 0.00 | 2,700 | 0 | 0 | |\n| 1.00 | 2,700 | 2,700 | 2,700 | |\n| 2.00 | 2,700 | 2,700 | 5,400 | |\n| 3.00 | 2,700 | 2,700 | 8,100 | |\n| Device | Routing | Invert | Outlet Devices | |\n| #1 | Primary | 1.00' | 20.0' long x 0.5' breadth Broad-Crested Rectangular Weir Head (feet) 0.20 0.40 0.60 0.80 1.00 Coef. (English) 2.80 2.92 3.08 3.30 3.32 | |\n| #2 | Primary | 0.15' | 2.5\" Vert. Orifice/Grate C= 0.600 | |\n| #3 | Discarded | 0.00' | 1.50 in/hr Exfiltration over Surface area | |\n| Discarded OutFlow Max=0.09 cfs @ 10.00 hrs HW=0.03' (Free Discharge) -3=Exfiltration (Exfiltration Controls 0.09 cfs) | | | | |\n| Primary OutFlow Max=0.34 cfs @ 12.42 hrs HW=1.02' (Free Discharge) -1=Broad-Crested Rectangular Weir (Weir Controls 0.20 cfs @ 0.43 fps) -2=Orifice/Grate (Orifice Controls 0.14 cfs @ 4.22 fps) | | | | |\n\n\nSource: HydroCAD® Summary Report; HydroCAD is a registered trademark of HydroCAD Software Solutions LLC. Used with permission.\n\nThe post-construction peak flow discharges from the proposed small-scale infiltration basin, which are labeled \"Primary\" flow rates in the above listed reports, were calculated to be 0.03, 0.09 and 0.36 cfs for the 2-, 10- and 100-year design storms, respectively. Adding the hydrograph to the corresponding flow rates generated by the undisturbed drainage area Post-A2, yields the total calculated peak flow rates of Post-A drainage area: 0.19, 0.78 and 2.26 cfs for the 2-, 10- and 100-year design storms, respectively. The table on the following page compares the allowable design storm peak flow rates for the post-construction condition for Post-A drainage area at point of analysis A to those calculated for the post-construction condition to check whether the design meets the requirement to reduce the peak flow rates, respectively, to 50, 75 and 80% of the pre-construction peak flow rates.\n\n[Source PDF](SOURCE.pdf#page=53)"}
{"metadata": {"source_document": "NJ BMP", "version_year": "2026", "chapter_subchapter": "Chapter 5", "citation": "BMP 2026, Ch 5, p. 54", "topic": "Table 25"}, "programmatic_checks": {}, "content_markdown": "# Stormwater Management Quantity and Quality Standards and Computations\n\n## Table 25\n\n| Post-construction Drainage Area Designation | Allowable Design Storm Peak Flow Rate (cfs) | | | Design Storm Peak Flow Rates with one Small-Scale Infiltration Basin (cfs) | | |\n| --- | --- | --- | --- | --- | --- | --- |\n| | 2-year | 10-year | 100-year | 2-year | 10-year | 100-year |\n| Post-A1 (parking lot/ gravel) | 0.04 | 0.23 | 0.70 | 0.03 | 0.09 | 0.36 |\n| Post-A2 (undisturbed area/ pasture) | 0.19 | 0.78 | 2.26 | 0.19 | 0.78 | 2.26 |\n| Post-A | 0.23 | 1.01 | 2.96 | 0.22 | 0.86 | 2.57 |\n\nSource context and notes:\n\n# Stormwater Management Quantity and Quality Standards and Computations\n\nSource revision: January 2026.\n\nThe post-construction peak flow rates for each of the proposed drainage areas are shown below (after the incorporation of stormwater management measures).\n\n\n| Post-construction Drainage Area Designation | Allowable Design Storm Peak Flow Rate (cfs) | | | Design Storm Peak Flow Rates with one Small-Scale Infiltration Basin (cfs) | | |\n| --- | --- | --- | --- | --- | --- | --- |\n| | 2-year | 10-year | 100-year | 2-year | 10-year | 100-year |\n| Post-A1 (parking lot/ gravel) | 0.04 | 0.23 | 0.70 | 0.03 | 0.09 | 0.36 |\n| Post-A2 (undisturbed area/ pasture) | 0.19 | 0.78 | 2.26 | 0.19 | 0.78 | 2.26 |\n| Post-A | 0.23 | 1.01 | 2.96 | 0.22 | 0.86 | 2.57 |\n\n\n# Step 4: Perform the Required Groundwater Mounding Analysis\n\nThe design of the small-scale infiltration basin must include a groundwater mounding analysis to verify the drain time within 72 hours and whether there is an adverse hydraulic impact to the groundwater level due to the infiltration practice, in accordance with N.J.A.C. 7:8-5.2(h).\n\nThe NJDEP Hantush Spreadsheet is used for the groundwater mounding analysis for which guidance is included in Chapter 13 of this manual. For this example, the small-scale infiltration basin measures 52 ft by 52 ft. The recharge rate, R, is the design permeability rate, which is one half the tested permeability rate, and equals $0.5 \\times 3.0 \\mathrm{in/hr} = 1.5 \\mathrm{in/hr}$ . The parameters for specific yield, $S_{\\mathrm{y}}$ , and the horizontal hydraulic conductivity, Kh, will be set at the default values specified in Chapter 13. The horizontal hydraulic conductivity rate is 5 times the recharge rate since the site, located in Ocean County, is in the Coastal Plain. The x and y values are equal to half of the respective basin dimensions.\n\n[Source PDF](SOURCE.pdf#page=54)"}
{"metadata": {"source_document": "NJ BMP", "version_year": "2026", "chapter_subchapter": "Chapter 5", "citation": "BMP 2026, Ch 5, p. 55", "topic": "Table 26"}, "programmatic_checks": {}, "content_markdown": "# Stormwater Management Quantity and Quality Standards and Computations\n\n## Table 26\n\n| Input Values | | | | | | | | | | | | |\n| --- | --- | --- | --- | --- | --- | --- | --- | --- | --- | --- | --- | --- |\n| 1.50 | R | Recharge rate (permeability rate) (in/hr) | | | | | | | | | | |\n| 0.150 | Sy | Specific yield, Sy (dimensionless) | | | | | | | | | | |\n| | | default value is 0.15; max value is 0.2 provided that a lab test data is submitted | | | | | | | | | | |\n| 7.50 | Kh | Horizontal hydraulic conductivity (in/hr) | | | | | | | | | | |\n| | | Kh = 5xRecharge Rate (B) in the coastal plain: Kh=R outside the coastal plain | | | | | | | | | | |\n| 26.000 | x | 1/2 length of basin (x direction, in feet) | | | | | | | | | | |\n| 26.000 | y | 1/2 width of basin (y direction, in feet) | | | | | | | | | | |\n| 15.69 | t | Duration of infiltration period (hours) | | | | | | | | | | |\n| 10.000 | hi(0) | Initial thickness of saturated zone (feet) | | | | | | | | | | |\n| | | | | | | | | | | | | |\n| 16.26 | h(max) | Maximum thickness of saturated zone (beneath center of basin at end of infiltration period) | | | | | | | | | | |\n| 6.26 | Δh(max) | Maximum groundwater mounding (beneath center of basin at end of infiltration period) | | | | | | | | | | |\n| Ground-water Mounding, in feet | Distance from center of basin in x direction, in feet | | | | | | | | | | | |\n| 6.259 | 0 | Re-Calculate Now | | | | | | | | | | |\n| 5.991 | 10 | | | | | | | | | | | |\n| 5.123 | 20 | | | | | | | | | | | |\n| 5.558 | 30 | | | | | | | | | | | |\n| 2.206 | 40 | | | | | | | | | | | |\n| 1.287 | 50 | | | | | | | | | | | |\n| 0.710 | 60 | | | | | | | | | | | |\n| 0.572 | 70 | | | | | | | | | | | |\n| 0.186 | 80 | | | | | | | | | | | |\n| 0.093 | 90 | | | | | | | | | | | |\n| | | | | | | | | | | | | |\n| | | | | | | | | | | | | |\n| | | | | | | | | | | | | |\n| | | | | | | | | | | | | |\n| | | | | | | | | | | | | |\n\nSource context and notes:\n\n# Stormwater Management Quantity and Quality Standards and Computations\n\nSource revision: January 2026.\n\nDuration of infiltration period, $t(hr) = \\frac{\\text{Discarded Volume via Exfiltration (cf)} \\times 12 \\text{ in}/ft}{\\text{Infiltration area (sf)} \\times \\text{Exfiltration rate (in/hr)}} = \\frac{5,296 \\text{ cf} \\times 12 \\text{ in}/ft}{2,700 \\text{ sf} \\times 1.5 \\text{ in/hr}} = 15.69 \\text{ hr}$\n\nThe initial thickness of the saturated zone, $hi(0)$, is set at the default value. Clicking on the blue button labeled \"Re-Calculate Now\" produced the results depicted below.\n\n\n| Input Values | | | | | | | | | | | | |\n| --- | --- | --- | --- | --- | --- | --- | --- | --- | --- | --- | --- | --- |\n| 1.50 | R | Recharge rate (permeability rate) (in/hr) | | | | | | | | | | |\n| 0.150 | Sy | Specific yield, Sy (dimensionless) | | | | | | | | | | |\n| | | default value is 0.15; max value is 0.2 provided that a lab test data is submitted | | | | | | | | | | |\n| 7.50 | Kh | Horizontal hydraulic conductivity (in/hr) | | | | | | | | | | |\n| | | Kh = 5xRecharge Rate (B) in the coastal plain: Kh=R outside the coastal plain | | | | | | | | | | |\n| 26.000 | x | 1/2 length of basin (x direction, in feet) | | | | | | | | | | |\n| 26.000 | y | 1/2 width of basin (y direction, in feet) | | | | | | | | | | |\n| 15.69 | t | Duration of infiltration period (hours) | | | | | | | | | | |\n| 10.000 | hi(0) | Initial thickness of saturated zone (feet) | | | | | | | | | | |\n| | | | | | | | | | | | | |\n| 16.26 | h(max) | Maximum thickness of saturated zone (beneath center of basin at end of infiltration period) | | | | | | | | | | |\n| 6.26 | Δh(max) | Maximum groundwater mounding (beneath center of basin at end of infiltration period) | | | | | | | | | | |\n| Ground-water Mounding, in feet | Distance from center of basin in x direction, in feet | | | | | | | | | | | |\n| 6.259 | 0 | Re-Calculate Now | | | | | | | | | | |\n| 5.991 | 10 | | | | | | | | | | | |\n| 5.123 | 20 | | | | | | | | | | | |\n| 5.558 | 30 | | | | | | | | | | | |\n| 2.206 | 40 | | | | | | | | | | | |\n| 1.287 | 50 | | | | | | | | | | | |\n| 0.710 | 60 | | | | | | | | | | | |\n| 0.572 | 70 | | | | | | | | | | | |\n| 0.186 | 80 | | | | | | | | | | | |\n| 0.093 | 90 | | | | | | | | | | | |\n| | | | | | | | | | | | | |\n| | | | | | | | | | | | | |\n| | | | | | | | | | | | | |\n| | | | | | | | | | | | | |\n| | | | | | | | | | | | | |\n\n\nThe results show that the maximum height of the groundwater mounding, $\\Delta h(\\max)$, is 6.26 ft. Since the groundwater table is 8 ft below the existing ground elevation, the elevated groundwater table will be 1.74 ft below the existing ground level at the center of the small-scale infiltration basin at the moment all of the stormwater runoff has infiltrated into the sand layer. However, the proposed small-scale basin provides 2 ft of temporary storage for stormwater, as depicted above by the light blue rectangle. The basin also includes a sand layer that is 0.5 ft deep, shown in tan. The bottom surface of the BMP is 2.0 ft below the existing ground elevation. Since the elevated groundwater table will be only 1.74 ft below the existing ground elevation, the elevated groundwater level will have an adverse impact on the drainage of the basin.\n\nSince there is an adverse impact on the drainage of the basin, the rate of exfiltration will also be impacted, meaning the ability of the basin to drain will be reduced. A smaller recharge rate must be\n\n[Source PDF](SOURCE.pdf#page=55)"}
{"metadata": {"source_document": "NJ BMP", "version_year": "2026", "chapter_subchapter": "Chapter 5", "citation": "BMP 2026, Ch 5, p. 57", "topic": "Table 27"}, "programmatic_checks": {}, "content_markdown": "# Stormwater Management Quantity and Quality Standards and Computations\n\n## Table 27\n\n| Inflow Area = 10,890 sf, 0.00% Impervious, Inflow Depth = 8.72\" for 100-Year event | | | | |\n| --- | --- | --- | --- | --- |\n| Inflow = 2.31 cfs @ 12.10 hrs, Volume= 7,912 cf | | | | |\n| Outflow = 0.65 cfs @ 12.30 hrs, Volume= 7,912 cf, Atten= 72%, Lag= 11.8 min | | | | |\n| Discarded = 0.07 cfs @ 9.28 hrs, Volume= 4,603 cf | | | | |\n| Primary = 0.58 cfs @ 12.30 hrs, Volume= 3,309 cf | | | | |\n| Routing by Stor-Ind method, Time Span= 0.00-48.00 hrs, dt= 0.04 hrs | | | | |\n| Peak Elev= 1.04' @ 12.30 hrs Surf Area= 2,700 sf Storage= 2,802 cf | | | | |\n| Plug-Flow detention time= 124.3 min calculated for 7,912 cf (100% of inflow) | | | | |\n| Center-of-Mass det. time= 124.1 min (873.0 - 748.9) | | | | |\n| Volume Invert Avail Storage Storage Description | | | | |\n| #1 0.00' 8,100 cf Custom Stage Data (Prismatic) Listed below (Recalc) | | | | |\n| Elevation (feet) Surf Area (sq-ft) Inc.Store (cubic-feet) Cum.Store (cubic-feet) | | | | |\n| 0.00 | 2,700 | 0 | 0 | |\n| 1.00 | 2,700 | 2,700 | 2,700 | |\n| 2.00 | 2,700 | 2,700 | 5,400 | |\n| 3.00 | 2,700 | 2,700 | 8,100 | |\n| Device Routing Invert Outlet Devices | | | | |\n| #1 Primary 1.00' 20.0' long x 0.5' breadth Broad-Crested Rectangular Weir | | | | |\n| | | Head (feet) 0.20 0.40 0.60 0.80 1.00 | | |\n| | | Coef. (English) 2.80 2.92 3.08 3.30 3.32 | | |\n| #2 Primary 0.15' 2.5\" Vert. Orifice/Grate C= 0.600 | | | | |\n| #3 Discarded 0.00' 1.10 in/hr Exfiltration over Surface area | | | | |\n| Discarded OutFlow Max=0.07 cfs @ 9.28 hrs HW=0.03' (Free Discharge) | | | | |\n| -3=Exfiltration (Exfiltration Controls 0.07 cfs) | | | | |\n| Primary OutFlow Max=0.54 cfs @ 12.30 hrs HW=1.04' (Free Discharge) | | | | |\n| -1=Broad-Crested Rectangular Weir (Weir Controls 0.40 cfs @ 0.54 fps) | | | | |\n| -2=Orifice/Grate (Orifice Controls 0.15 cfs @ 4.26 fps) | | | | |\n\nSource context and notes:\n\n- Based on the methodology discussed above, the trial and error approach for the current example is as follows:\n\na. Reduce the recharge rate from 1.5 in/hr to 1.1 in/hr.\nb. The exfiltration rate used in the new basin routing calculation equals the recharge rate from Step a. The results are shown in the image below:\n\nRevised 100-year Design Storm Post-Construction Condition Summary Report\nExfiltration = 1.1 in/hr\n\n\n| Inflow Area = 10,890 sf, 0.00% Impervious, Inflow Depth = 8.72\" for 100-Year event | | | | |\n| --- | --- | --- | --- | --- |\n| Inflow = 2.31 cfs @ 12.10 hrs, Volume= 7,912 cf | | | | |\n| Outflow = 0.65 cfs @ 12.30 hrs, Volume= 7,912 cf, Atten= 72%, Lag= 11.8 min | | | | |\n| Discarded = 0.07 cfs @ 9.28 hrs, Volume= 4,603 cf | | | | |\n| Primary = 0.58 cfs @ 12.30 hrs, Volume= 3,309 cf | | | | |\n| Routing by Stor-Ind method, Time Span= 0.00-48.00 hrs, dt= 0.04 hrs | | | | |\n| Peak Elev= 1.04' @ 12.30 hrs Surf Area= 2,700 sf Storage= 2,802 cf | | | | |\n| Plug-Flow detention time= 124.3 min calculated for 7,912 cf (100% of inflow) | | | | |\n| Center-of-Mass det. time= 124.1 min (873.0 - 748.9) | | | | |\n| Volume Invert Avail Storage Storage Description | | | | |\n| #1 0.00' 8,100 cf Custom Stage Data (Prismatic) Listed below (Recalc) | | | | |\n| Elevation (feet) Surf Area (sq-ft) Inc.Store (cubic-feet) Cum.Store (cubic-feet) | | | | |\n| 0.00 | 2,700 | 0 | 0 | |\n| 1.00 | 2,700 | 2,700 | 2,700 | |\n| 2.00 | 2,700 | 2,700 | 5,400 | |\n| 3.00 | 2,700 | 2,700 | 8,100 | |\n| Device Routing Invert Outlet Devices | | | | |\n| #1 Primary 1.00' 20.0' long x 0.5' breadth Broad-Crested Rectangular Weir | | | | |\n| | | Head (feet) 0.20 0.40 0.60 0.80 1.00 | | |\n| | | Coef. (English) 2.80 2.92 3.08 3.30 3.32 | | |\n| #2 Primary 0.15' 2.5\" Vert. Orifice/Grate C= 0.600 | | | | |\n| #3 Discarded 0.00' 1.10 in/hr Exfiltration over Surface area | | | | |\n| Discarded OutFlow Max=0.07 cfs @ 9.28 hrs HW=0.03' (Free Discharge) | | | | |\n| -3=Exfiltration (Exfiltration Controls 0.07 cfs) | | | | |\n| Primary OutFlow Max=0.54 cfs @ 12.30 hrs HW=1.04' (Free Discharge) | | | | |\n| -1=Broad-Crested Rectangular Weir (Weir Controls 0.40 cfs @ 0.54 fps) | | | | |\n| -2=Orifice/Grate (Orifice Controls 0.15 cfs @ 4.26 fps) | | | | |\n\n\nSource: HydroCAD® Summary Report; HydroCAD is a registered trademark of HydroCAD Software Solutions LLC. Used with permission.\n\nThe 100-year storm routing calculation shows the exfiltration (discarded) volume is reduced from 5,296 cf at an exfiltration rate of 1.5 in/hr to 4,603 cf at 1.1 in/hr. The peak flow rate (primary) from the proposed small-scale infiltration basin (Post-A1) is increased from 0.36 cfs to 0.58 cfs and must be added to the flow from Post-A2 (undisturbed area/ pasture). The new value for the combined peak flow rate by hydrograph addition is 2.81 cfs, which does not exceed the allowable design storm peak flow rate, 2.96 cfs, for the Post-A drainage area.\n\ni. The peak flow rates for 2- and 10-year design storms from the small-scale infiltration basin are calculated and the results are shown below:\n\n[Source PDF](SOURCE.pdf#page=57)"}
{"metadata": {"source_document": "NJ BMP", "version_year": "2026", "chapter_subchapter": "Chapter 5", "citation": "BMP 2026, Ch 5, p. 58", "topic": "Table 28"}, "programmatic_checks": {}, "content_markdown": "# Stormwater Management Quantity and Quality Standards and Computations\n\n## Table 28\n\n| Inflow Area = 10,890 sf, 0.00% Impervious, Inflow Depth = 2.95\" for 2-Year event | | | | |\n| --- | --- | --- | --- | --- |\n| Inflow = 0.84 cfs @ 12.10 hrs, Volume= 2,674 cf | | | | |\n| Outflow = 0.11 cfs @ 12.62 hrs, Volume= 2,674 cf, Atten= 87%, Lag= 31.4 min | | | | |\n| Discarded = 0.07 cfs @ 11.36 hrs, Volume= 2,395 cf | | | | |\n| Primary = 0.04 cfs @ 12.62 hrs, Volume= 279 cf | | | | |\n| Routing by Stor-Ind method, Time Span= 0.00-48.00 hrs, dt= 0.04 hrs | | | | |\n| Peak Elev= 0.32' @ 12.62 hrs Surf.Area= 2,700 sf Storage= 877 cf | | | | |\n| Plug-Flow detention time= 75.8 min calculated for 2,672 cf (100% of inflow) | | | | |\n| Center-of-Mass det. time= 75.8 min (849.3 - 773.5) | | | | |\n| Volume | Invert | Avail.Storage | Storage Description | |\n| #1 | 0.00' | 8,100 cf | Custom Stage Data (Prismatic) Listed below (Recalc) | |\n| Elevation (feet) | Surf.Area (sq-ft) | Inc.Store (cubic-feet) | Cum.Store (cubic-feet) | |\n| 0.00 | 2,700 | 0 | 0 | |\n| 1.00 | 2,700 | 2,700 | 2,700 | |\n| 2.00 | 2,700 | 2,700 | 5,400 | |\n| 3.00 | 2,700 | 2,700 | 8,100 | |\n| Device | Routing | Invert | Outlet Devices | |\n| #1 | Primary | 1.00' | 20.0' long x 0.5' breadth Broad-Crested Rectangular Weir
Head (feet) 0.20 0.40 0.60 0.80 1.00
Coef. (English) 2.80 2.92 3.08 3.30 3.32 | |\n| #2 | Primary | 0.15' | 2.5\" Vert. Orifice/Grate C= 0.600 | |\n| #3 | Discarded | 0.00' | 1.10 in/hr Exfiltration over Surface area | |\n| Discarded OutFlow Max=0.07 cfs @ 11.36 hrs HW=0.03' (Free Discharge)
-3=Exfiltration (Exfiltration Controls 0.07 cfs) | | | | |\n| Primary OutFlow Max=0.04 cfs @ 12.62 hrs HW=0.32' (Free Discharge)
-1=Broad-Crested Rectangular Weir (Controls 0.00 cfs)
-2=Orifice/Grate (Orifice Controls 0.04 cfs @ 1.42 fps) | | | | |\n\nSource context and notes:\n\n# Stormwater Management Quantity and Quality Standards and Computations\n\nSource revision: January 2026.\n\n# Revised 2-year Design Storm Post-Construction Condition Summary Report\nExfiltration = 1.1 in/hr and Basin Footprint Remains = 2,700 sf\n\n\n| Inflow Area = 10,890 sf, 0.00% Impervious, Inflow Depth = 2.95\" for 2-Year event | | | | |\n| --- | --- | --- | --- | --- |\n| Inflow = 0.84 cfs @ 12.10 hrs, Volume= 2,674 cf | | | | |\n| Outflow = 0.11 cfs @ 12.62 hrs, Volume= 2,674 cf, Atten= 87%, Lag= 31.4 min | | | | |\n| Discarded = 0.07 cfs @ 11.36 hrs, Volume= 2,395 cf | | | | |\n| Primary = 0.04 cfs @ 12.62 hrs, Volume= 279 cf | | | | |\n| Routing by Stor-Ind method, Time Span= 0.00-48.00 hrs, dt= 0.04 hrs | | | | |\n| Peak Elev= 0.32' @ 12.62 hrs Surf.Area= 2,700 sf Storage= 877 cf | | | | |\n| Plug-Flow detention time= 75.8 min calculated for 2,672 cf (100% of inflow) | | | | |\n| Center-of-Mass det. time= 75.8 min (849.3 - 773.5) | | | | |\n| Volume | Invert | Avail.Storage | Storage Description | |\n| #1 | 0.00' | 8,100 cf | Custom Stage Data (Prismatic) Listed below (Recalc) | |\n| Elevation (feet) | Surf.Area (sq-ft) | Inc.Store (cubic-feet) | Cum.Store (cubic-feet) | |\n| 0.00 | 2,700 | 0 | 0 | |\n| 1.00 | 2,700 | 2,700 | 2,700 | |\n| 2.00 | 2,700 | 2,700 | 5,400 | |\n| 3.00 | 2,700 | 2,700 | 8,100 | |\n| Device | Routing | Invert | Outlet Devices | |\n| #1 | Primary | 1.00' | 20.0' long x 0.5' breadth Broad-Crested Rectangular Weir
Head (feet) 0.20 0.40 0.60 0.80 1.00
Coef. (English) 2.80 2.92 3.08 3.30 3.32 | |\n| #2 | Primary | 0.15' | 2.5\" Vert. Orifice/Grate C= 0.600 | |\n| #3 | Discarded | 0.00' | 1.10 in/hr Exfiltration over Surface area | |\n| Discarded OutFlow Max=0.07 cfs @ 11.36 hrs HW=0.03' (Free Discharge)
-3=Exfiltration (Exfiltration Controls 0.07 cfs) | | | | |\n| Primary OutFlow Max=0.04 cfs @ 12.62 hrs HW=0.32' (Free Discharge)
-1=Broad-Crested Rectangular Weir (Controls 0.00 cfs)
-2=Orifice/Grate (Orifice Controls 0.04 cfs @ 1.42 fps) | | | | |\n\n\nSource: HydroCAD® Summary Report; HydroCAD is a registered trademark of HydroCAD Software Solutions LLC. Used with permission.\n\n[Source PDF](SOURCE.pdf#page=58)"}
{"metadata": {"source_document": "NJ BMP", "version_year": "2026", "chapter_subchapter": "Chapter 5", "citation": "BMP 2026, Ch 5, p. 59", "topic": "Table 29"}, "programmatic_checks": {}, "content_markdown": "# Stormwater Management Quantity and Quality Standards and Computations\n\n## Table 29\n\n| Inflow Area = 10,890 sf, 0.00% Impervious, Inflow Depth = 4.93\" for 10-Year event | | | | |\n| --- | --- | --- | --- | --- |\n| Inflow = 1.34 cfs @ 12.10 hrs, Volume= 4,474 cf | | | | |\n| Outflow = 0.16 cfs @ 12.73 hrs, Volume= 4,474 cf, Atten= 88%, Lag= 37.6 min | | | | |\n| Discarded = 0.07 cfs @ 10.72 hrs, Volume= 3,351 cf | | | | |\n| Primary = 0.10 cfs @ 12.73 hrs, Volume= 1,123 cf | | | | |\n| Routing by Stor-Ind method, Time Span= 0.00-48.00 hrs, dt= 0.04 hrs | | | | |\n| Peak Elev= 0.60' @ 12.73 hrs Surf.Area= 2,700 sf Storage= 1,607 cf | | | | |\n| Plug-Flow detention time= 98.7 min calculated for 4,471 cf (100% of inflow) | | | | |\n| Center-of-Mass det. time= 98.6 min (859.2 - 760.6) | | | | |\n| Volume | Invert | Avail.Storage | Storage Description | |\n| #1 | 0.00' | 8,100 cf | Custom Stage Data (Prismatic) Listed below (Recalc) | |\n| Elevation (feet) | Surf.Area (sq-ft) | Inc.Store (cubic-feet) | Cum.Store (cubic-feet) | |\n| 0.00 | 2,700 | 0 | 0 | |\n| 1.00 | 2,700 | 2,700 | 2,700 | |\n| 2.00 | 2,700 | 2,700 | 5,400 | |\n| 3.00 | 2,700 | 2,700 | 8,100 | |\n| Device | Routing | Invert | Outlet Devices | |\n| #1 | Primary | 1.00' | 20.0' long x 0.5' breadth Broad-Crested Rectangular Weir Head (feet) 0.20 0.40 0.60 0.80 1.00 Coef. (English) 2.80 2.92 3.08 3.30 3.32 | |\n| #2 | Primary | 0.15' | 2.5\" Vert. Orifice/Grate C= 0.600 | |\n| #3 | Discarded | 0.00' | 1.10 in/hr Exfiltration over Surface area | |\n| Discarded OutFlow Max=0.07 cfs @ 10.72 hrs HW=0.03' (Free Discharge)3=Exfiltration (Exfiltration Controls 0.07 cfs) | | | | |\n| Primary OutFlow Max=0.10 cfs @ 12.73 hrs HW=0.60' (Free Discharge)1=Broad-Crested Rectangular Weir (Controls 0.00 cfs)2=Orifice/Grate (Orifice Controls 0.10 cfs @ 2.81 fps) | | | | |\n\nSource context and notes:\n\n# Stormwater Management Quantity and Quality Standards and Computations\n\nSource revision: January 2026.\n\nRevised 10-year Design Storm Post-Construction Condition Summary Report\nExfiltration = 1.1 in/hr and Basin Footprint Remains = 2,700 sf\n\n\n| Inflow Area = 10,890 sf, 0.00% Impervious, Inflow Depth = 4.93\" for 10-Year event | | | | |\n| --- | --- | --- | --- | --- |\n| Inflow = 1.34 cfs @ 12.10 hrs, Volume= 4,474 cf | | | | |\n| Outflow = 0.16 cfs @ 12.73 hrs, Volume= 4,474 cf, Atten= 88%, Lag= 37.6 min | | | | |\n| Discarded = 0.07 cfs @ 10.72 hrs, Volume= 3,351 cf | | | | |\n| Primary = 0.10 cfs @ 12.73 hrs, Volume= 1,123 cf | | | | |\n| Routing by Stor-Ind method, Time Span= 0.00-48.00 hrs, dt= 0.04 hrs | | | | |\n| Peak Elev= 0.60' @ 12.73 hrs Surf.Area= 2,700 sf Storage= 1,607 cf | | | | |\n| Plug-Flow detention time= 98.7 min calculated for 4,471 cf (100% of inflow) | | | | |\n| Center-of-Mass det. time= 98.6 min (859.2 - 760.6) | | | | |\n| Volume | Invert | Avail.Storage | Storage Description | |\n| #1 | 0.00' | 8,100 cf | Custom Stage Data (Prismatic) Listed below (Recalc) | |\n| Elevation (feet) | Surf.Area (sq-ft) | Inc.Store (cubic-feet) | Cum.Store (cubic-feet) | |\n| 0.00 | 2,700 | 0 | 0 | |\n| 1.00 | 2,700 | 2,700 | 2,700 | |\n| 2.00 | 2,700 | 2,700 | 5,400 | |\n| 3.00 | 2,700 | 2,700 | 8,100 | |\n| Device | Routing | Invert | Outlet Devices | |\n| #1 | Primary | 1.00' | 20.0' long x 0.5' breadth Broad-Crested Rectangular Weir Head (feet) 0.20 0.40 0.60 0.80 1.00 Coef. (English) 2.80 2.92 3.08 3.30 3.32 | |\n| #2 | Primary | 0.15' | 2.5\" Vert. Orifice/Grate C= 0.600 | |\n| #3 | Discarded | 0.00' | 1.10 in/hr Exfiltration over Surface area | |\n| Discarded OutFlow Max=0.07 cfs @ 10.72 hrs HW=0.03' (Free Discharge)3=Exfiltration (Exfiltration Controls 0.07 cfs) | | | | |\n| Primary OutFlow Max=0.10 cfs @ 12.73 hrs HW=0.60' (Free Discharge)1=Broad-Crested Rectangular Weir (Controls 0.00 cfs)2=Orifice/Grate (Orifice Controls 0.10 cfs @ 2.81 fps) | | | | |\n\n\nSource: HydroCAD® Summary Report; HydroCAD is a registered trademark of HydroCAD Software Solutions LLC. Used with permission.\n\nii. A summary of design storm peak flow rates for two-, 10- and 100-year design storms are shown below:\n\nPost-construction Peak Flow Rates of Drainage Area Post-A, with the Incorporation of a Green Infrastructure BMP (1.1 in/hr Exfiltration Rate)\n\n[Source PDF](SOURCE.pdf#page=59)"}
{"metadata": {"source_document": "NJ BMP", "version_year": "2026", "chapter_subchapter": "Chapter 5", "citation": "BMP 2026, Ch 5, p. 59", "topic": "Table 30"}, "programmatic_checks": {}, "content_markdown": "# Stormwater Management Quantity and Quality Standards and Computations\n\n## Table 30\n\n| Post-construction Drainage Area Designation | Allowable Design Storm Peak Flow Rate (cfs) | | | Design Storm Peak Flow Rates with a Small-Scale Infiltration Basin (cfs) | | |\n| --- | --- | --- | --- | --- | --- | --- |\n| | 2-year | 10-year | 100-year | 2-year | 10-year | 100-year |\n| Post-A1 (parking lot/ gravel) | 0.04 | 0.23 | 0.70 | 0.04 | 0.10 | 0.58 |\n| Post-A2 (undisturbed area/ pasture) | 0.19 | 0.78 | 2.26 | 0.19 | 0.78 | 2.26 |\n| Post-A | 0.23 | 1.01 | 2.96 | 0.23 | 0.87 | 2.80 |\n\nSource context and notes:\n\n| Primary OutFlow Max=0.10 cfs @ 12.73 hrs HW=0.60' (Free Discharge)1=Broad-Crested Rectangular Weir (Controls 0.00 cfs)2=Orifice/Grate (Orifice Controls 0.10 cfs @ 2.81 fps) | | | | |\n\nSource: HydroCAD® Summary Report; HydroCAD is a registered trademark of HydroCAD Software Solutions LLC. Used with permission.\n\nii. A summary of design storm peak flow rates for two-, 10- and 100-year design storms are shown below:\n\nPost-construction Peak Flow Rates of Drainage Area Post-A, with the Incorporation of a Green Infrastructure BMP (1.1 in/hr Exfiltration Rate)\n\n\n| Post-construction Drainage Area Designation | Allowable Design Storm Peak Flow Rate (cfs) | | | Design Storm Peak Flow Rates with a Small-Scale Infiltration Basin (cfs) | | |\n| --- | --- | --- | --- | --- | --- | --- |\n| | 2-year | 10-year | 100-year | 2-year | 10-year | 100-year |\n| Post-A1 (parking lot/ gravel) | 0.04 | 0.23 | 0.70 | 0.04 | 0.10 | 0.58 |\n| Post-A2 (undisturbed area/ pasture) | 0.19 | 0.78 | 2.26 | 0.19 | 0.78 | 2.26 |\n| Post-A | 0.23 | 1.01 | 2.96 | 0.23 | 0.87 | 2.80 |\n\n\n\n[Source PDF](SOURCE.pdf#page=59)"}
{"metadata": {"source_document": "NJ BMP", "version_year": "2026", "chapter_subchapter": "Chapter 5", "citation": "BMP 2026, Ch 5, p. 61", "topic": "Table 31"}, "programmatic_checks": {}, "content_markdown": "# Stormwater Management Quantity and Quality Standards and Computations\n\n## Table 31\n\n| Drainage Area Name | Pre-construction Design Storm Flow Rate (cfs) | | | Post-construction Design Storm Flow Rate (cfs) | | |\n| --- | --- | --- | --- | --- | --- | --- |\n| | 2-year | 10-year | 100-year | 2-year | 10-year | 100-year |\n| Post-B1 (building or walkway) | 1.76 | 2.81 | 4.80 | 0.57 | 0.90 | 1.54 |\n| Post-B2 (open space/grass > 75% and woods) | 0.17 | 0.45 | 1.07 | 0.90 | 1.91 | 3.93 |\n| Total Post-B (Hydrograph addition) | 1.83 | 3.03 | 5.37 | 1.24 | 2.41 | 4.74 |\n\nSource context and notes:\n\n## Step 5: Since the option to meet the Stormwater Runoff Quantity Standards of N.J.A.C. 7:8-5.6(b)3 was selected in Step 2, Determine Whether the Post-B Drainage Area Meets the Same Standard\n\nFrom Page 50, the 2-, 10- and 100-year design storm total peak flow rates from Post-B drainage area are 1.24, 2.41 and 4.74 cfs, respectively. The corresponding allowable design storm peak flow rates for 2-, 10- and 100-year design storms are 0.92, 2.27 and 4.30 cfs. Therefore, Post-B drainage area does not meet the Stormwater Runoff Quantity Requirements of N.J.A.C. 7:8-5.6(b)3.\n\n## Step 6: Determine Whether the Post-B Drainage Area Meets the Stormwater Runoff Quantity Standards of N.J.A.C. 7:8-5.6(b)1\n\nAs demonstrated above, the Post-B drainage area does not meet the Stormwater Runoff Quantity Control Requirements of N.J.A.C. 7:8-5.6(b)3. A comparison of the pre- and post-construction design storm peak flow rates is made to determine whether Post-B drainage area meets the Stormwater Runoff Quantity Control Requirements of N.J.A.C. 7:8-5.6(b)1.\n\n\n| Drainage Area Name | Pre-construction Design Storm Flow Rate (cfs) | | | Post-construction Design Storm Flow Rate (cfs) | | |\n| --- | --- | --- | --- | --- | --- | --- |\n| | 2-year | 10-year | 100-year | 2-year | 10-year | 100-year |\n| Post-B1 (building or walkway) | 1.76 | 2.81 | 4.80 | 0.57 | 0.90 | 1.54 |\n| Post-B2 (open space/grass > 75% and woods) | 0.17 | 0.45 | 1.07 | 0.90 | 1.91 | 3.93 |\n| Total Post-B (Hydrograph addition) | 1.83 | 3.03 | 5.37 | 1.24 | 2.41 | 4.74 |\n\n\nThe comparisons between the pre- and post-construction design storm peak flow rates show that the peak flow rates of the post-construction condition are less than the peak flow rates of the pre-construction. However, N.J.A.C. 7:8-5.6(b)1 does not require a comparison of the pre- and post-construction condition peak flow rates. This standard requires the demonstration that the post-construction runoff hydrographs for the 2-, 10- and 100-year design storm events do not exceed, at any point in time, the pre-construction runoff hydrographs for the same storm events. Therefore, from the definition of a hydrograph on Page 2, this standard means that the flow rates of the post-construction hydrograph at every point in time must be less than the flow rates of the pre-construction hydrograph for the same instance of time. A comparison of the 100-year design storm hydrographs for the pre-construction and post-construction conditions for the Post-B drainage area is shown below.\n\n[Source PDF](SOURCE.pdf#page=61)"}
{"metadata": {"source_document": "NJ BMP", "version_year": "2026", "chapter_subchapter": "Chapter 5", "citation": "BMP 2026, Ch 5, p. 63", "topic": "Table 32"}, "programmatic_checks": {}, "content_markdown": "# Stormwater Management Quantity and Quality Standards and Computations\n\n## Table 32\n\n| Time (hours) | Pre-construction flow (cfs) | Post-construction flow (cfs) | Difference (Post-Pre) (cfs) | Time (hours) | Pre-construction flow (cfs) | Post-construction flow (cfs) | Difference (Post-Pre) (cfs) |\n| --- | --- | --- | --- | --- | --- | --- | --- |\n| 12.00 | 4.57 | 2.79 | -1.78 | 12.55 | 1.19 | 1.13 | -0.06 |\n| 12.05 | 5.44 | 3.94 | -1.5 | 12.60 | 1.07 | 1.04 | -0.03 |\n| 12.10 | 4.35 | 4.78 | 0.43 | 12.65 | 0.97 | 0.93 | -0.04 |\n| 12.15 | 3.28 | 4.54 | 1.26 | 12.70 | 0.88 | 0.87 | -0.01 |\n| 12.20 | 3.02 | 4.12 | 1.10 | 12.75 | 0.8 | 0.82 | 0.02 |\n| 12.25 | 2.87 | 3.06 | 0.19 | 12.80 | 0.74 | 0.78 | 0.04 |\n| 12.30 | 2.63 | 2.39 | -0.24 | 12.85 | 0.68 | 0.74 | 0.06 |\n| 12.35 | 2.34 | 1.89 | -0.45 | 12.90 | 0.64 | 0.71 | 0.07 |\n| 12.40 | 2.03 | 1.6 | -0.43 | 12.95 | 0.6 | 0.68 | 0.08 |\n| 12.45 | 1.73 | 1.38 | -0.35 | 13.00 | 0.56 | 0.65 | 0.09 |\n| 12.50 | 1.43 | 1.26 | -0.17 | | | | |\n\nSource context and notes:\n\n# Stormwater Management Quantity and Quality Standards and Computations\n\nSource revision: January 2026.\n\n\n| Time (hours) | Pre-construction flow (cfs) | Post-construction flow (cfs) | Difference (Post-Pre) (cfs) | Time (hours) | Pre-construction flow (cfs) | Post-construction flow (cfs) | Difference (Post-Pre) (cfs) |\n| --- | --- | --- | --- | --- | --- | --- | --- |\n| 12.00 | 4.57 | 2.79 | -1.78 | 12.55 | 1.19 | 1.13 | -0.06 |\n| 12.05 | 5.44 | 3.94 | -1.5 | 12.60 | 1.07 | 1.04 | -0.03 |\n| 12.10 | 4.35 | 4.78 | 0.43 | 12.65 | 0.97 | 0.93 | -0.04 |\n| 12.15 | 3.28 | 4.54 | 1.26 | 12.70 | 0.88 | 0.87 | -0.01 |\n| 12.20 | 3.02 | 4.12 | 1.10 | 12.75 | 0.8 | 0.82 | 0.02 |\n| 12.25 | 2.87 | 3.06 | 0.19 | 12.80 | 0.74 | 0.78 | 0.04 |\n| 12.30 | 2.63 | 2.39 | -0.24 | 12.85 | 0.68 | 0.74 | 0.06 |\n| 12.35 | 2.34 | 1.89 | -0.45 | 12.90 | 0.64 | 0.71 | 0.07 |\n| 12.40 | 2.03 | 1.6 | -0.43 | 12.95 | 0.6 | 0.68 | 0.08 |\n| 12.45 | 1.73 | 1.38 | -0.35 | 13.00 | 0.56 | 0.65 | 0.09 |\n| 12.50 | 1.43 | 1.26 | -0.17 | | | | |\n\n\nStep 7: Since Post-B Drainage Area Failed to Meet the Stormwater Runoff Quantity Control Standards of N.J.A.C. 7:8-5.6(b), on its own, Determine Whether the Site as a Whole Meets the Stormwater Runoff Quantity Control Standards of N.J.A.C. 7:8-5.6(b)\n\nThe question here is whether stormwater runoff from drainage areas Post-A and Post-B can be combined together to meet the Stormwater Runoff Quantity Control requirements either under N.J.A.C. 7:8-5.6(b)3 or N.J.A.C. 7:8-5.6(b)1. The table below illustrates combining post-construction flow rates from drainage areas A and B for each of the regulatory design storms.\n\n| Post-construction Drainage Area Designation | Allowable Design Storm Peak Flow Rate (cfs) under N.J.A.C. 7:8-5.6(b)3 | | | Design Storm Peak Flow Rate with a Small-Scale Infiltration Basin in Drainage Area Post-A | | |\n| --- | --- | --- | --- | --- | --- | --- |\n| | 2-year | 10-year | 100-year | 2-year | 10-year | 100-year |\n| Post-A | 0.23 | 1.01 | 2.96 | 0.23 | 0.88 | 2.81 |\n| Post-B | 0.92 | 2.27 | 4.30 | 1.33 | 2.56 | 4.05 |\n| Post A and B Combined | 1.15 | 3.28 | 7.26 | 1.28 | 2.79 | 5.95 |\n\n[Source PDF](SOURCE.pdf#page=63)"}
{"metadata": {"source_document": "NJ BMP", "version_year": "2026", "chapter_subchapter": "Chapter 5", "citation": "BMP 2026, Ch 5, p. 63", "topic": "Table 33"}, "programmatic_checks": {}, "content_markdown": "# Stormwater Management Quantity and Quality Standards and Computations\n\n## Table 33\n\n| Post-construction Drainage Area Designation | Allowable Design Storm Peak Flow Rate (cfs) under N.J.A.C. 7:8-5.6(b)3 | | | Design Storm Peak Flow Rate with a Small-Scale Infiltration Basin in Drainage Area Post-A | | |\n| --- | --- | --- | --- | --- | --- | --- |\n| | 2-year | 10-year | 100-year | 2-year | 10-year | 100-year |\n| Post-A | 0.23 | 1.01 | 2.96 | 0.23 | 0.88 | 2.81 |\n| Post-B | 0.92 | 2.27 | 4.30 | 1.33 | 2.56 | 4.05 |\n| Post A and B Combined | 1.15 | 3.28 | 7.26 | 1.28 | 2.79 | 5.95 |\n\nSource context and notes:\n\n| 12.40 | 2.03 | 1.6 | -0.43 | 12.95 | 0.6 | 0.68 | 0.08 |\n| 12.45 | 1.73 | 1.38 | -0.35 | 13.00 | 0.56 | 0.65 | 0.09 |\n| 12.50 | 1.43 | 1.26 | -0.17 | | | | |\n\nStep 7: Since Post-B Drainage Area Failed to Meet the Stormwater Runoff Quantity Control Standards of N.J.A.C. 7:8-5.6(b), on its own, Determine Whether the Site as a Whole Meets the Stormwater Runoff Quantity Control Standards of N.J.A.C. 7:8-5.6(b)\n\nThe question here is whether stormwater runoff from drainage areas Post-A and Post-B can be combined together to meet the Stormwater Runoff Quantity Control requirements either under N.J.A.C. 7:8-5.6(b)3 or N.J.A.C. 7:8-5.6(b)1. The table below illustrates combining post-construction flow rates from drainage areas A and B for each of the regulatory design storms.\n\n\n| Post-construction Drainage Area Designation | Allowable Design Storm Peak Flow Rate (cfs) under N.J.A.C. 7:8-5.6(b)3 | | | Design Storm Peak Flow Rate with a Small-Scale Infiltration Basin in Drainage Area Post-A | | |\n| --- | --- | --- | --- | --- | --- | --- |\n| | 2-year | 10-year | 100-year | 2-year | 10-year | 100-year |\n| Post-A | 0.23 | 1.01 | 2.96 | 0.23 | 0.88 | 2.81 |\n| Post-B | 0.92 | 2.27 | 4.30 | 1.33 | 2.56 | 4.05 |\n| Post A and B Combined | 1.15 | 3.28 | 7.26 | 1.28 | 2.79 | 5.95 |\n\n\nThe combined post-construction 10- and 100-year storm peak flow rates for the whole site are 2.79 and 5.95 cfs, respectively, which are less than the allowable 10- and 100-year design storm peak flow rates, 3.28 cfs and 7.26 cfs, respectively. However, the combined post-construction 2-year peak flow rate of 1.28 cfs is greater than the allowable 2-year design storm peak flow rate of 1.15 cfs.\n\nIf the hydrographs of the 2-year storm for the pre- and post-construction conditions are visually compared in a plot, it seems that the stormwater runoff quantity control requirements, when analyzing the site as a whole, for the 2-year design storm have been met under N.J.A.C. 7:8-5.6(b)1\n\n[Source PDF](SOURCE.pdf#page=63)"}
{"metadata": {"source_document": "NJ BMP", "version_year": "2026", "chapter_subchapter": "Chapter 5", "citation": "BMP 2026, Ch 5, p. 66", "topic": "Table 34"}, "programmatic_checks": {}, "content_markdown": "# Stormwater Management Quantity and Quality Standards and Computations\n\n## Table 34\n\n| Inflow Area = 3,485 sf,100.00% Impervious, Inflow Depth = 8.96\" for 100-Year event | | | | |\n| --- | --- | --- | --- | --- |\n| Inflow = 0.77 cfs @ 12.07 hrs, Volume= 2,602 cf | | | | |\n| Outflow = 0.17 cfs @ 12.31 hrs, Volume= 2,602 cf, Atten= 77%, Lag= 14.4 min | | | | |\n| Discarded = 0.01 cfs @ 2.90 hrs, Volume= 967 cf | | | | |\n| Primary = 0.17 cfs @ 12.31 hrs, Volume= 1,635 cf | | | | |\n| Routing by Stor-Ind method, Time Span= 0.00-48.00 hrs, dt= 0.05 hrs | | | | |\n| Peak Elev= 1.96' @ 12.31 hrs Surf.Area= 550 sf Storage= 1,078 cf | | | | |\n| Plug-Flow detention time= 295.7 min calculated for 2,602 cf (100% of inflow) | | | | |\n| Center-of-Mass det. time= 295.6 min ( 1,031.8 - 736.2 ) | | | | |\n| Volume | Invert | Avail.Storage | Storage Description | |\n| #1 | 0.00' | 2,200 cf | Custom Stage Data (Prismatic) Listed below | |\n| Elevation (feet) | Surf.Area (sq-ft) | Inc.Store (cubic-feet) | Cum.Store (cubic-feet) | |\n| 0.00 | 550 | 0 | 0 | |\n| 1.00 | 550 | 550 | 550 | |\n| 2.00 | 550 | 550 | 1,100 | |\n| 3.00 | 550 | 550 | 1,650 | |\n| 4.00 | 550 | 550 | 2,200 | |\n| Device | Routing | Invert | Outlet Devices | |\n| #1 | Discarded | 0.00' | 0.50 in/hr Exfiltration over Surface area below 2.00' | |\n| #2 | Primary | 0.80' | 2.5\" Vert. Orifice/Grate C= 0.600 | |\n| Discarded OutFlow Max=0.01 cfs @ 2.90 hrs HW=0.04' (Free Discharge) | | | | |\n| +1=Exfiltration (Exfiltration Controls 0.01 cfs) | | | | |\n| Primary OutFlow Max=0.17 cfs @ 12.31 hrs HW=1.96' (Free Discharge) | | | | |\n| +2=Orifice/Grate (Orifice Controls 0.17 cfs @ 4.94 fps) | | | | |\n\nSource context and notes:\n\n# Stormwater Management Quantity and Quality Standards and Computations\n\nSource revision: January 2026.\n\n# 100-year Design Storm Summary Report\n\n\n| Inflow Area = 3,485 sf,100.00% Impervious, Inflow Depth = 8.96\" for 100-Year event | | | | |\n| --- | --- | --- | --- | --- |\n| Inflow = 0.77 cfs @ 12.07 hrs, Volume= 2,602 cf | | | | |\n| Outflow = 0.17 cfs @ 12.31 hrs, Volume= 2,602 cf, Atten= 77%, Lag= 14.4 min | | | | |\n| Discarded = 0.01 cfs @ 2.90 hrs, Volume= 967 cf | | | | |\n| Primary = 0.17 cfs @ 12.31 hrs, Volume= 1,635 cf | | | | |\n| Routing by Stor-Ind method, Time Span= 0.00-48.00 hrs, dt= 0.05 hrs | | | | |\n| Peak Elev= 1.96' @ 12.31 hrs Surf.Area= 550 sf Storage= 1,078 cf | | | | |\n| Plug-Flow detention time= 295.7 min calculated for 2,602 cf (100% of inflow) | | | | |\n| Center-of-Mass det. time= 295.6 min ( 1,031.8 - 736.2 ) | | | | |\n| Volume | Invert | Avail.Storage | Storage Description | |\n| #1 | 0.00' | 2,200 cf | Custom Stage Data (Prismatic) Listed below | |\n| Elevation (feet) | Surf.Area (sq-ft) | Inc.Store (cubic-feet) | Cum.Store (cubic-feet) | |\n| 0.00 | 550 | 0 | 0 | |\n| 1.00 | 550 | 550 | 550 | |\n| 2.00 | 550 | 550 | 1,100 | |\n| 3.00 | 550 | 550 | 1,650 | |\n| 4.00 | 550 | 550 | 2,200 | |\n| Device | Routing | Invert | Outlet Devices | |\n| #1 | Discarded | 0.00' | 0.50 in/hr Exfiltration over Surface area below 2.00' | |\n| #2 | Primary | 0.80' | 2.5\" Vert. Orifice/Grate C= 0.600 | |\n| Discarded OutFlow Max=0.01 cfs @ 2.90 hrs HW=0.04' (Free Discharge) | | | | |\n| +1=Exfiltration (Exfiltration Controls 0.01 cfs) | | | | |\n| Primary OutFlow Max=0.17 cfs @ 12.31 hrs HW=1.96' (Free Discharge) | | | | |\n| +2=Orifice/Grate (Orifice Controls 0.17 cfs @ 4.94 fps) | | | | |\n\n\nSource: HydroCAD® Summary Report; HydroCAD is a registered trademark of HydroCAD Software Solutions LLC. Used with permission.\n\nThe peak flow rates resulting from the proposed design are as follows:\n\n| Post-construction Drainage Area Designation | Allowable Design Storm Peak Flow Rate (cfs) | | | Design Storm Peak Flow Rates with two Small-Scale Bioretention Basin (cfs) | | |\n| --- | --- | --- | --- | --- | --- | --- |\n| | 2-year | 10-year | 100-year | 2-year | 10-year | 100-year |\n| Post-B1 (building/walkway) after two small-scale bioretention basins | 0.88 | 2.11 | 3.84 | 0.02 | 0.18 | 0.34 |\n| Post-B2 (open space, grass > 75% and woods) | 0.09 | 0.34 | 0.86 | 0.90 | 1.91 | 3.93 |\n| Post-B | 0.97 | 2.45 | 4.70 | 0.90 | 2.08 | 4.26 |\n\n[Source PDF](SOURCE.pdf#page=66)"}
{"metadata": {"source_document": "NJ BMP", "version_year": "2026", "chapter_subchapter": "Chapter 5", "citation": "BMP 2026, Ch 5, p. 66", "topic": "Table 35"}, "programmatic_checks": {}, "content_markdown": "# Stormwater Management Quantity and Quality Standards and Computations\n\n## Table 35\n\n| Post-construction Drainage Area Designation | Allowable Design Storm Peak Flow Rate (cfs) | | | Design Storm Peak Flow Rates with two Small-Scale Bioretention Basin (cfs) | | |\n| --- | --- | --- | --- | --- | --- | --- |\n| | 2-year | 10-year | 100-year | 2-year | 10-year | 100-year |\n| Post-B1 (building/walkway) after two small-scale bioretention basins | 0.88 | 2.11 | 3.84 | 0.02 | 0.18 | 0.34 |\n| Post-B2 (open space, grass > 75% and woods) | 0.09 | 0.34 | 0.86 | 0.90 | 1.91 | 3.93 |\n| Post-B | 0.97 | 2.45 | 4.70 | 0.90 | 2.08 | 4.26 |\n\nSource context and notes:\n\n| +1=Exfiltration (Exfiltration Controls 0.01 cfs) | | | | |\n| Primary OutFlow Max=0.17 cfs @ 12.31 hrs HW=1.96' (Free Discharge) | | | | |\n| +2=Orifice/Grate (Orifice Controls 0.17 cfs @ 4.94 fps) | | | | |\n\nSource: HydroCAD® Summary Report; HydroCAD is a registered trademark of HydroCAD Software Solutions LLC. Used with permission.\n\nThe peak flow rates resulting from the proposed design are as follows:\n\n\n| Post-construction Drainage Area Designation | Allowable Design Storm Peak Flow Rate (cfs) | | | Design Storm Peak Flow Rates with two Small-Scale Bioretention Basin (cfs) | | |\n| --- | --- | --- | --- | --- | --- | --- |\n| | 2-year | 10-year | 100-year | 2-year | 10-year | 100-year |\n| Post-B1 (building/walkway) after two small-scale bioretention basins | 0.88 | 2.11 | 3.84 | 0.02 | 0.18 | 0.34 |\n| Post-B2 (open space, grass > 75% and woods) | 0.09 | 0.34 | 0.86 | 0.90 | 1.91 | 3.93 |\n| Post-B | 0.97 | 2.45 | 4.70 | 0.90 | 2.08 | 4.26 |\n\n\n\n[Source PDF](SOURCE.pdf#page=66)"}
{"metadata": {"source_document": "NJ BMP", "version_year": "2026", "chapter_subchapter": "Chapter 5", "citation": "BMP 2026, Ch 5, p. 69", "topic": "Table 36"}, "programmatic_checks": {}, "content_markdown": "# Stormwater Management Quantity and Quality Standards and Computations\n\n## Table 36\n\n| Inflow Area = | 32,670 sf, 21.33% Impervious, Inflow Depth = 7.13\" for 100-Year event |\n| --- | --- |\n| Inflow = | 4.74 cfs @ 12.12 hrs, Volume= 19,411.7 cf |\n| Outflow = | 3.95 cfs @ 12.34 hrs, Volume= 19,411.7 cf, Atten= 17%, Lag= 13.6 min |\n| Routing by Stor-Ind+Trans method, Time Span= 0.00-48.00 hrs, dt= 0.05 hrs | |\n| Max. Velocity= 1.31 fps, Min. Travel Time= 8.3 min | |\n| Avg. Velocity = 0.26 fps, Avg. Travel Time= 40.9 min | |\n| Peak Storage= 1,980.0 cf @ 12.20 hrs | |\n| Average Depth at Peak Storage= 0.40' | |\n| Bank-Full Depth= 0.50' Flow Area= 4.0 sf, Capacity= 5.94 cfs | |\n| 6.00' x 0.50' deep channel, n= 0.030 Earth, grassed & winding | |\n| Side Slope Z-value= 4.0' Top Width= 10.00' | |\n| Length= 650.00' Slope= 0.0031' | |\n| Inlet Invert= 2.000', Outlet Invert= -0.015' | |\n\nSource context and notes:\n\n# Step 1: Design the Grass Swale\n\nGrass swales are one of the green infrastructure BMPs listed in Table 5-1 of N.J.A.C. 7:8-5.2, but as stated in this table, they cannot be used to meet the groundwater recharge or stormwater runoff quantity requirements of N.J.A.C. 7:8-5.4 and 5.6. However, grass swales can be designed to provide conveyance of stormwater runoff from one drainage area to another drainage area. A grass swale also can be designed to convey flows at a lower flow velocity, which results in a slower time of concentration, than that of a stormwater drainage pipe, which typically has a smooth surface.\n\nAssuming the grass swale has a bottom width of 6 ft, a depth of 0.5 ft, a slope of 0.46%, a length of 650 ft and a Manning's roughness coefficient 0.03, the grass swale will be able to convey the peak flow of stormwater runoff produced by the 100-year design storm with a runoff depth of 0.36 ft and a maximum flow velocity of 1.51 fps, which is under the maximum allowable velocity of 2.5 fps, for sandy clay loam soil texture as suggested in the Standards for Soil Erosion and Sediment Control in New Jersey.\n\n## Grass Swale Summary Report for the 100-year Design Storm\n\n\n| Inflow Area = | 32,670 sf, 21.33% Impervious, Inflow Depth = 7.13\" for 100-Year event |\n| --- | --- |\n| Inflow = | 4.74 cfs @ 12.12 hrs, Volume= 19,411.7 cf |\n| Outflow = | 3.95 cfs @ 12.34 hrs, Volume= 19,411.7 cf, Atten= 17%, Lag= 13.6 min |\n| Routing by Stor-Ind+Trans method, Time Span= 0.00-48.00 hrs, dt= 0.05 hrs | |\n| Max. Velocity= 1.31 fps, Min. Travel Time= 8.3 min | |\n| Avg. Velocity = 0.26 fps, Avg. Travel Time= 40.9 min | |\n| Peak Storage= 1,980.0 cf @ 12.20 hrs | |\n| Average Depth at Peak Storage= 0.40' | |\n| Bank-Full Depth= 0.50' Flow Area= 4.0 sf, Capacity= 5.94 cfs | |\n| 6.00' x 0.50' deep channel, n= 0.030 Earth, grassed & winding | |\n| Side Slope Z-value= 4.0' Top Width= 10.00' | |\n| Length= 650.00' Slope= 0.0031' | |\n| Inlet Invert= 2.000', Outlet Invert= -0.015' | |\n\n\nSource: HydroCAD® Summary Report; HydroCAD is a registered trademark of HydroCAD Software Solutions LLC. Used with permission.\n\n[Source PDF](SOURCE.pdf#page=69)"}
{"metadata": {"source_document": "NJ BMP", "version_year": "2026", "chapter_subchapter": "Chapter 5", "citation": "BMP 2026, Ch 5, p. 70", "topic": "Table 37"}, "programmatic_checks": {}, "content_markdown": "# Stormwater Management Quantity and Quality Standards and Computations\n\n## Table 37\n\n| Inflow Area = | 32,670 sf, 21.33% Impervious, Inflow Depth = 3.58\" for 10-Year event |\n| --- | --- |\n| Inflow = | 2.41 cfs @ 12.11 hrs, Volume= 9,742.6 cf |\n| Outflow = | 1.89 cfs @ 12.39 hrs, Volume= 9,742.5 cf, Atten= 22%, Lag= 16.9 min |\n| Routing by Stor-Ind+Trans method, Time Span= 0.00-48.00 hrs, dt= 0.05 hrs | |\n| Max. Velocity= 1.03 fps, Min. Travel Time= 10.6 min | |\n| Avg. Velocity = 0.21 fps, Avg. Travel Time= 51.4 min | |\n| Peak Storage= 1,208.8 cf @ 12.22 hrs | |\n| Average Depth at Peak Storage= 0.26' | |\n| Bank-Full Depth= 0.50' Flow Area= 4.0 sf, Capacity= 5.94 cfs | |\n| 6.00' x 0.50' deep channel, n= 0.030 Earth, grassed & winding | |\n| Side Slope Z-value= 4.0 ? Top Width= 10.00' | |\n| Length= 650.00' Slope= 0.0031 ? | |\n| Inlet Invert= 2.000', Outlet Invert= -0.015' | |\n\nSource context and notes:\n\n# Stormwater Management Quantity and Quality Standards and Computations\n\nSource revision: January 2026.\n\n# Grass Swale Summary Report for the 10-year Design Storm\n\n\n| Inflow Area = | 32,670 sf, 21.33% Impervious, Inflow Depth = 3.58\" for 10-Year event |\n| --- | --- |\n| Inflow = | 2.41 cfs @ 12.11 hrs, Volume= 9,742.6 cf |\n| Outflow = | 1.89 cfs @ 12.39 hrs, Volume= 9,742.5 cf, Atten= 22%, Lag= 16.9 min |\n| Routing by Stor-Ind+Trans method, Time Span= 0.00-48.00 hrs, dt= 0.05 hrs | |\n| Max. Velocity= 1.03 fps, Min. Travel Time= 10.6 min | |\n| Avg. Velocity = 0.21 fps, Avg. Travel Time= 51.4 min | |\n| Peak Storage= 1,208.8 cf @ 12.22 hrs | |\n| Average Depth at Peak Storage= 0.26' | |\n| Bank-Full Depth= 0.50' Flow Area= 4.0 sf, Capacity= 5.94 cfs | |\n| 6.00' x 0.50' deep channel, n= 0.030 Earth, grassed & winding | |\n| Side Slope Z-value= 4.0 ? Top Width= 10.00' | |\n| Length= 650.00' Slope= 0.0031 ? | |\n| Inlet Invert= 2.000', Outlet Invert= -0.015' | |\n\n\nSource: HydroCAD® Summary Report; HydroCAD is a registered trademark of HydroCAD Software Solutions LLC. Used with permission.\n\n# Grass Swale Summary Report for the 2-year Design Storm\n\n| Inflow Area = | 32,670 sf, 21.33% Impervious, Inflow Depth = 1.85\" for 2-Year event |\n| --- | --- |\n| Inflow = | 1.24 cfs @ 12.11 hrs, Volume= 5,027.6 cf |\n| Outflow = | 0.89 cfs @ 12.46 hrs, Volume= 5,027.6 cf, Atten= 28%, Lag= 21.3 min |\n| Routing by Stor-Ind+Trans method, Time Span= 0.00-48.00 hrs, dt= 0.05 hrs | |\n| Max. Velocity= 0.79 fps, Min. Travel Time= 13.7 min | |\n| Avg. Velocity = 0.17 fps, Avg. Travel Time= 62.8 min | |\n| Peak Storage= 738.6 cf @ 12.23 hrs | |\n| Average Depth at Peak Storage= 0.17' | |\n| Bank-Full Depth= 0.50' Flow Area= 4.0 sf, Capacity= 5.94 cfs | |\n| 6.00' x 0.50' deep channel, n= 0.030 Earth, grassed & winding | |\n| Side Slope Z-value= 4.0 ? Top Width= 10.00' | |\n| Length= 650.00' Slope= 0.0031 ? | |\n| Inlet Invert= 2.000', Outlet Invert= -0.015' | |\n\n[Source PDF](SOURCE.pdf#page=70)"}
{"metadata": {"source_document": "NJ BMP", "version_year": "2026", "chapter_subchapter": "Chapter 5", "citation": "BMP 2026, Ch 5, p. 70", "topic": "Table 38"}, "programmatic_checks": {}, "content_markdown": "# Stormwater Management Quantity and Quality Standards and Computations\n\n## Table 38\n\n| Inflow Area = | 32,670 sf, 21.33% Impervious, Inflow Depth = 1.85\" for 2-Year event |\n| --- | --- |\n| Inflow = | 1.24 cfs @ 12.11 hrs, Volume= 5,027.6 cf |\n| Outflow = | 0.89 cfs @ 12.46 hrs, Volume= 5,027.6 cf, Atten= 28%, Lag= 21.3 min |\n| Routing by Stor-Ind+Trans method, Time Span= 0.00-48.00 hrs, dt= 0.05 hrs | |\n| Max. Velocity= 0.79 fps, Min. Travel Time= 13.7 min | |\n| Avg. Velocity = 0.17 fps, Avg. Travel Time= 62.8 min | |\n| Peak Storage= 738.6 cf @ 12.23 hrs | |\n| Average Depth at Peak Storage= 0.17' | |\n| Bank-Full Depth= 0.50' Flow Area= 4.0 sf, Capacity= 5.94 cfs | |\n| 6.00' x 0.50' deep channel, n= 0.030 Earth, grassed & winding | |\n| Side Slope Z-value= 4.0 ? Top Width= 10.00' | |\n| Length= 650.00' Slope= 0.0031 ? | |\n| Inlet Invert= 2.000', Outlet Invert= -0.015' | |\n\nSource context and notes:\n\n| Side Slope Z-value= 4.0 ? Top Width= 10.00' | |\n| Length= 650.00' Slope= 0.0031 ? | |\n| Inlet Invert= 2.000', Outlet Invert= -0.015' | |\n\nSource: HydroCAD® Summary Report; HydroCAD is a registered trademark of HydroCAD Software Solutions LLC. Used with permission.\n\n# Grass Swale Summary Report for the 2-year Design Storm\n\n\n| Inflow Area = | 32,670 sf, 21.33% Impervious, Inflow Depth = 1.85\" for 2-Year event |\n| --- | --- |\n| Inflow = | 1.24 cfs @ 12.11 hrs, Volume= 5,027.6 cf |\n| Outflow = | 0.89 cfs @ 12.46 hrs, Volume= 5,027.6 cf, Atten= 28%, Lag= 21.3 min |\n| Routing by Stor-Ind+Trans method, Time Span= 0.00-48.00 hrs, dt= 0.05 hrs | |\n| Max. Velocity= 0.79 fps, Min. Travel Time= 13.7 min | |\n| Avg. Velocity = 0.17 fps, Avg. Travel Time= 62.8 min | |\n| Peak Storage= 738.6 cf @ 12.23 hrs | |\n| Average Depth at Peak Storage= 0.17' | |\n| Bank-Full Depth= 0.50' Flow Area= 4.0 sf, Capacity= 5.94 cfs | |\n| 6.00' x 0.50' deep channel, n= 0.030 Earth, grassed & winding | |\n| Side Slope Z-value= 4.0 ? Top Width= 10.00' | |\n| Length= 650.00' Slope= 0.0031 ? | |\n| Inlet Invert= 2.000', Outlet Invert= -0.015' | |\n\n\nSource: HydroCAD® Summary Report; HydroCAD is a registered trademark of HydroCAD Software Solutions LLC. Used with permission.\n\nTo summarize the reports listed above, the stormwater runoff peak flow rates for the 2-, 10- and 100-year design storms, generated by the Post-B drainage area and conveyed by the grass swale to the discharge point of convergence in Post-A drainage area are listed in the table below.\n\n| Post-construction Drainage Area | Design Storm Peak Flow Rates with a Grass Swale (cfs) | | |\n| --- | --- | --- | --- |\n| | 2-year | 10-year | 100-year |\n| Post-B | 0.89 | 1.89 | 3.95 |\n\n[Source PDF](SOURCE.pdf#page=70)"}
{"metadata": {"source_document": "NJ BMP", "version_year": "2026", "chapter_subchapter": "Chapter 5", "citation": "BMP 2026, Ch 5, p. 70", "topic": "Table 39"}, "programmatic_checks": {}, "content_markdown": "# Stormwater Management Quantity and Quality Standards and Computations\n\n## Table 39\n\n| Post-construction Drainage Area | Design Storm Peak Flow Rates with a Grass Swale (cfs) | | |\n| --- | --- | --- | --- |\n| | 2-year | 10-year | 100-year |\n| Post-B | 0.89 | 1.89 | 3.95 |\n\nSource context and notes:\n\n| Side Slope Z-value= 4.0 ? Top Width= 10.00' | |\n| Length= 650.00' Slope= 0.0031 ? | |\n| Inlet Invert= 2.000', Outlet Invert= -0.015' | |\n\nSource: HydroCAD® Summary Report; HydroCAD is a registered trademark of HydroCAD Software Solutions LLC. Used with permission.\n\nTo summarize the reports listed above, the stormwater runoff peak flow rates for the 2-, 10- and 100-year design storms, generated by the Post-B drainage area and conveyed by the grass swale to the discharge point of convergence in Post-A drainage area are listed in the table below.\n\n\n| Post-construction Drainage Area | Design Storm Peak Flow Rates with a Grass Swale (cfs) | | |\n| --- | --- | --- | --- |\n| | 2-year | 10-year | 100-year |\n| Post-B | 0.89 | 1.89 | 3.95 |\n\n\n\n[Source PDF](SOURCE.pdf#page=70)"}
{"metadata": {"source_document": "NJ BMP", "version_year": "2026", "chapter_subchapter": "Chapter 5", "citation": "BMP 2026, Ch 5, p. 71", "topic": "Table 40"}, "programmatic_checks": {}, "content_markdown": "# Stormwater Management Quantity and Quality Standards and Computations\n\n## Table 40\n\n| Post-construction Drainage Area Designation | Allowable Design Storm Peak Flow Rate (cfs) per the N.J.A.C. 7:8-5.6(b)3 Standard | | | Design Storm Peak Flow Rate (cfs) | | |\n| --- | --- | --- | --- | --- | --- | --- |\n| | 2-year | 10-year | 100-year | 2-year | 10-year | 100-year |\n| Post-A | 0.23 | 1.01 | 2.96 | 0.23 | 0.87 | 2.80 |\n| Post-B | 0.92 | 2.27 | 4.30 | 0.89 | 1.89 | 3.95 |\n| Post A and B Combined | 1.15 | 3.28 | 7.26 | 1.12 | 2.76 | 6.75 |\n\nSource context and notes:\n\nSource revision: January 2026.\n\nStep 2: Address Stormwater Runoff Quantity Control\n\nAlthough not mentioned in the initial description, the stormwater runoff generated by the proposed building and walkway will flow as overland flow across the proposed lawn area. The lawn area is graded to direct this runoff to the same grass swale and discharge point for the Post-A drainage area. The stormwater runoff generated by both the roof and the non-vehicular walkway do not require water quality treatment. Drainage area Post-A1 will still require a small-scale infiltration basin to provide the required stormwater runoff quantity and quality controls, in addition to the groundwater recharge requirement for the stormwater runoff generated by the proposed gravel parking lot. Drainage area Post-A2 will not be disturbed and is therefore not subject to the stormwater runoff quality and quantity requirements, nor those for groundwater recharge.\n\nIn this example, the initial description states that the stormwater runoff from Drainage Areas A and B converge into one discharge point (i.e., the point of analysis A) before leaving the site. Therefore, the peak flow rates for 2-, 10- and 100-year design storms of the two drainage areas can be added to calculate the peak flow rates at the discharge location.\n\n\n| Post-construction Drainage Area Designation | Allowable Design Storm Peak Flow Rate (cfs) per the N.J.A.C. 7:8-5.6(b)3 Standard | | | Design Storm Peak Flow Rate (cfs) | | |\n| --- | --- | --- | --- | --- | --- | --- |\n| | 2-year | 10-year | 100-year | 2-year | 10-year | 100-year |\n| Post-A | 0.23 | 1.01 | 2.96 | 0.23 | 0.87 | 2.80 |\n| Post-B | 0.92 | 2.27 | 4.30 | 0.89 | 1.89 | 3.95 |\n| Post A and B Combined | 1.15 | 3.28 | 7.26 | 1.12 | 2.76 | 6.75 |\n\n\nAs the results show in the table above, each of the combined post-construction peak flow rates for the 2-, 10- and 100-year design storms are less than the respective allowable design storm peak flow rates. Therefore, the site as a whole meets the stormwater runoff quantity standards of N.J.A.C. 7:8-5.6(b)3.\n\nStep 3: Address Groundwater Recharge\n\nRegarding groundwater recharge, both drainage area Post-B and drainage area Pre-B contain 0.5 acres of impervious surface, meaning there is no change in impervious cover area from the pre-construction condition to the post-construction condition. However, the project also proposes to change the land cover from woods to grass lawn, which will reduce the amount of groundwater recharge provided. Therefore, an evaluation of the groundwater recharge deficit is needed. See Chapter 6 of this manual for guidance on performing a groundwater recharge analysis.\n\n[Source PDF](SOURCE.pdf#page=71)"}
{"metadata": {"source_document": "NJ BMP", "version_year": "2026", "chapter_subchapter": "Chapter 5", "citation": "BMP 2026, Ch 5, p. 74", "topic": "Table 41"}, "programmatic_checks": {}, "content_markdown": "# Stormwater Management Quantity and Quality Standards and Computations\n\n## Table 41\n\n| Frequency of Storms | NOAA NWS PFDS Precipitation Depth (inches) |\n| --- | --- |\n| 2-year | 3.30 |\n| 10-year | 5.02 |\n| 100-year | 8.42 |\n\nSource context and notes:\n\n# Stormwater Management Quantity and Quality Standards and Computations\n\nSource revision: January 2026.\n\n\n| Frequency of Storms | NOAA NWS PFDS Precipitation Depth (inches) |\n| --- | --- |\n| 2-year | 3.30 |\n| 10-year | 5.02 |\n| 100-year | 8.42 |\n\n\n## Step 2: Calculate the Current and Projected Precipitation Depths\n\nTo calculate the current and projected precipitation depths, the current precipitation adjustment factors and the future precipitation change factors must be obtained from Table 5-5 and Table 5-6, respectively, of the Stormwater Management rules. The site is in Somerset County. The current precipitation adjustment factors for the 2-, 10- and 100-year current storm events in Somerset County are 1.00, 1.03 and 1.09, respectively. The future precipitation change factors for the 2-, 10- and 100-year projected storm events in Somerset County are 1.19, 1.24 and 1.48, respectively.\n\nMultiply the current precipitation adjustment factor with the precipitation depths obtained in Step 1 to obtain the current precipitation depths. Multiply the future precipitation change factors with the precipitation depths obtained in Step 1 to obtain the projected precipitation depths for the design storms. The current and projected precipitation depths for each storm frequency are listed in the table below.\n\n[Source PDF](SOURCE.pdf#page=74)"}
{"metadata": {"source_document": "NJ BMP", "version_year": "2026", "chapter_subchapter": "Chapter 5", "citation": "BMP 2026, Ch 5, p. 74", "topic": "Table 42"}, "programmatic_checks": {}, "content_markdown": "# Stormwater Management Quantity and Quality Standards and Computations\n\n## Table 42\n\n| Design Storms | NOAA NWS PFDS Precipitation Depth (inches) | Current Precipitation Depths (inches) | Future Projected Precipitation Depths (inches) |\n| --- | --- | --- | --- |\n| 2-year | 3.30 | 3.30 | 3.93 |\n| 10-year | 5.02 | 5.17 | 6.22 |\n| 100-year | 8.42 | 9.18 | 12.46 |\n\nSource context and notes:\n\n| 100-year | 8.42 |\n\n## Step 2: Calculate the Current and Projected Precipitation Depths\n\nTo calculate the current and projected precipitation depths, the current precipitation adjustment factors and the future precipitation change factors must be obtained from Table 5-5 and Table 5-6, respectively, of the Stormwater Management rules. The site is in Somerset County. The current precipitation adjustment factors for the 2-, 10- and 100-year current storm events in Somerset County are 1.00, 1.03 and 1.09, respectively. The future precipitation change factors for the 2-, 10- and 100-year projected storm events in Somerset County are 1.19, 1.24 and 1.48, respectively.\n\nMultiply the current precipitation adjustment factor with the precipitation depths obtained in Step 1 to obtain the current precipitation depths. Multiply the future precipitation change factors with the precipitation depths obtained in Step 1 to obtain the projected precipitation depths for the design storms. The current and projected precipitation depths for each storm frequency are listed in the table below.\n\n\n| Design Storms | NOAA NWS PFDS Precipitation Depth (inches) | Current Precipitation Depths (inches) | Future Projected Precipitation Depths (inches) |\n| --- | --- | --- | --- |\n| 2-year | 3.30 | 3.30 | 3.93 |\n| 10-year | 5.02 | 5.17 | 6.22 |\n| 100-year | 8.42 | 9.18 | 12.46 |\n\n\n## Step 3: Design the SSGI Bioretention Basins for the Water Quality Design Standard\n\nThe Water Quality Design Storm (WQDS) is 1.25 inches of precipitation in two hours. The runoff volume of the WQDS calculated by using the NRCS Methodology is 1,878 cf. Two SSGI bioretention BMPs are designed to treat the WQDS runoff from the proposed parking lot. Each proposed SSGI bioretention BMP will receive and treat 938.9 cf of total WQDS runoff. Each SSGI bioretention BMP is designed to have a footprint of 950 sf and a depth of 2 ft. Although the ground elevations may vary at different locations of a project site, for the sake of simplicity in illustrating this design example, the proposed ground elevations of the two proposed SSGI bioretention BMPs are both assumed to be at EL. 102.00 ft. The bottoms of the proposed SSGI bioretention BMPs are both assumed to be at EL. 100.00 ft.\n\n[Source PDF](SOURCE.pdf#page=74)"}
{"metadata": {"source_document": "NJ BMP", "version_year": "2026", "chapter_subchapter": "Chapter 5", "citation": "BMP 2026, Ch 5, p. 75", "topic": "Table 43"}, "programmatic_checks": {}, "content_markdown": "# Stormwater Management Quantity and Quality Standards and Computations\n\n## Table 43\n\n| Ex_5-8 NoExfiltration NJ DEP 2-hr WQL Rainfall=1.25° Prepared by NJDEP Printed 7/12/2023 HydroCAD® 10.00-25 s/n 07311 © 2019 HydroCAD Software Solutions LLC Page 139 | | | | | |\n| --- | --- | --- | --- | --- | --- |\n| Summary for Pond 34P: SS Bioretention S | | | | | |\n| Inflow Area = 10,890 sf,100.00% Impervious, Inflow Depth = 1.03\" for WQL event | | | | | |\n| Inflow = 0.77 cfs @ 1.08 hrs, Volume= 938.9 cf | | | | | |\n| Outflow = 0.00 cfs @ 0.00 hrs, Volume= 0.0 cf, Atten= 100%, Lag= 0.0 min | | | | | |\n| Primary = 0.00 cfs @ 0.00 hrs, Volume= 0.0 cf | | | | | |\n| Routing by Dyn-Stor-Ind method, Time Span= 0.00-36.00 hrs, dt= 0.01 hrs | | | | | |\n| Peak Elev= 100.988' @ 2.09 hrs Surf.Area= 950 sf Storage= 938.9 cf | | | | | |\n| Plug-Flow detention time= (not calculated: initial storage exceeds outflow) | | | | | |\n| Center-of-Mass det. time= (not calculated: no outflow) | | | | | |\n| Volume Invert Avail.Storage Storage Description | | | | | |\n| #1 100.000' 1,900.0 cf Custom Stage Data (Conic) Listed below (Recalc) | | | | | |\n| Elevation Surf.Area Inc.Store Cumb.-feet Cum.Store Wet.Area (feet) (sq-ft) (cubic-feet) (sq-ft) | | | | | |\n| 100.000 950 0.0 0.0 950 | | | | | |\n| 101.000 950 950.0 950.0 1,059 | | | | | |\n| 102.000 950 950.0 1,900.0 1,169 | | | | | |\n| Device Routing Invert Outlet Devices | | | | | |\n| #1 Device 2 100.990' 24.0\" W x 12.0\" H Vert. Orifice/Grate C= 0.600 | | | | | |\n| #2 Primary 100.000' 12.0\" Round Culvert L= 150.00' CPP, projecting, no headwall, Ke= 0.900 Inlet / Outlet Invert= 100.000' / 98.500' S= 0.0100' /' C= 0.900 n= 0.011 Concrete pipe, straight & clean, Flow Area= 0.79 sf | | | | | |\n| Primary OutFlow Max=0.00 cfs @ 0.00 hrs HW=100.000' TW=95.500' (Dynamic Tailwater) 2=Culvert ( Controls 0.00 cfs) 1=Orifice/Grate ( Controls 0.00 cfs) | | | | | |\n\nSource context and notes:\n\nSource revision: January 2026.\n\nThe proposed outlet structure has a 24-inch by 12-inch opening as the orifice with a 12-inch pipe located down-gradient of the orifice to convey the runoff from storms larger than the WQDS to the down-gradient SSGI infiltration BMPs. The invert of the 24-inch by 12-inch orifice shall be set at 0.99 ft above the BMP bottom to provide a storage and infiltration volume of 938.9 cf.\n\nThe WQDS routing calculation for the proposed SSGI bioretention BMP is depicted below. Exfiltration is not used in the routing. Take note that the design of the outlet control structures and the configuration of the BMPs are just one example of the many possible variations that an engineer may incorporate into the design.\n\nWQDS Routing Summary Report\n\n\n| Ex_5-8 NoExfiltration NJ DEP 2-hr WQL Rainfall=1.25° Prepared by NJDEP Printed 7/12/2023 HydroCAD® 10.00-25 s/n 07311 © 2019 HydroCAD Software Solutions LLC Page 139 | | | | | |\n| --- | --- | --- | --- | --- | --- |\n| Summary for Pond 34P: SS Bioretention S | | | | | |\n| Inflow Area = 10,890 sf,100.00% Impervious, Inflow Depth = 1.03\" for WQL event | | | | | |\n| Inflow = 0.77 cfs @ 1.08 hrs, Volume= 938.9 cf | | | | | |\n| Outflow = 0.00 cfs @ 0.00 hrs, Volume= 0.0 cf, Atten= 100%, Lag= 0.0 min | | | | | |\n| Primary = 0.00 cfs @ 0.00 hrs, Volume= 0.0 cf | | | | | |\n| Routing by Dyn-Stor-Ind method, Time Span= 0.00-36.00 hrs, dt= 0.01 hrs | | | | | |\n| Peak Elev= 100.988' @ 2.09 hrs Surf.Area= 950 sf Storage= 938.9 cf | | | | | |\n| Plug-Flow detention time= (not calculated: initial storage exceeds outflow) | | | | | |\n| Center-of-Mass det. time= (not calculated: no outflow) | | | | | |\n| Volume Invert Avail.Storage Storage Description | | | | | |\n| #1 100.000' 1,900.0 cf Custom Stage Data (Conic) Listed below (Recalc) | | | | | |\n| Elevation Surf.Area Inc.Store Cumb.-feet Cum.Store Wet.Area (feet) (sq-ft) (cubic-feet) (sq-ft) | | | | | |\n| 100.000 950 0.0 0.0 950 | | | | | |\n| 101.000 950 950.0 950.0 1,059 | | | | | |\n| 102.000 950 950.0 1,900.0 1,169 | | | | | |\n| Device Routing Invert Outlet Devices | | | | | |\n| #1 Device 2 100.990' 24.0\" W x 12.0\" H Vert. Orifice/Grate C= 0.600 | | | | | |\n| #2 Primary 100.000' 12.0\" Round Culvert L= 150.00' CPP, projecting, no headwall, Ke= 0.900 Inlet / Outlet Invert= 100.000' / 98.500' S= 0.0100' /' C= 0.900 n= 0.011 Concrete pipe, straight & clean, Flow Area= 0.79 sf | | | | | |\n| Primary OutFlow Max=0.00 cfs @ 0.00 hrs HW=100.000' TW=95.500' (Dynamic Tailwater) 2=Culvert ( Controls 0.00 cfs) 1=Orifice/Grate ( Controls 0.00 cfs) | | | | | |\n\n\nSource: HydroCAD® Summary Report; HydroCAD is a registered trademark of HydroCAD Software Solutions LLC. Used with permission.\n\nRouting for the projected 100-year storm is also an essential calculation which will ascertain whether the proposed BMP will not be overtopped during the projected 100-year storm. The result shows that the outlet structure of each of the proposed SSGI bioretention BMPs has sufficient capacity to pass runoff flow to its down-gradient SSGI infiltration BMP without being overtopped during the projected 100-year storm which addresses the impacts of climate change.\n\n[Source PDF](SOURCE.pdf#page=75)"}
{"metadata": {"source_document": "NJ BMP", "version_year": "2026", "chapter_subchapter": "Chapter 5", "citation": "BMP 2026, Ch 5, p. 76", "topic": "Table 44"}, "programmatic_checks": {}, "content_markdown": "# Stormwater Management Quantity and Quality Standards and Computations\n\n## Table 44\n\n| Ex_5-8 NoExfiltration | | | | NOAA 24-hr C Proj_100yr Rainfall=12.46\" | |\n| --- | --- | --- | --- | --- | --- |\n| Prepared by NJDEP | | | | Printed 7/12/2023 | |\n| HydroCAD® 10.00-25 s/n 07311 © 2019 HydroCAD Software Solutions LLC | | | | Page 79 | |\n| Summary for Pond 34P: SS Bioretention S | | | | | |\n| Inflow Area = 10,890 sf,100.00% Impervious, Inflow Depth = 12.22\" for Proj_100yr event | | | | | |\n| Inflow = 3.66 cfs @ 12.09 hrs, Volume= 11,088.2 cf | | | | | |\n| Outflow = 3.25 cfs @ 12.11 hrs, Volume= 10,147.7 cf, Atten= 11%, Lag= 1.2 min | | | | | |\n| Primary = 3.25 cfs @ 12.11 hrs, Volume= 10,147.7 cf | | | | | |\n| Routing by Dyn-Stor-Ind method, Time Span= 0.00-36.00 hrs, dt= 0.01 hrs | | | | | |\n| Peak Elev= 101.687' @ 12.11 hrs Surf.Area= 950 sf Storage= 1,602.7 cf | | | | | |\n| Plug-Flow detention time= 97.2 min calculated for 10,144.8 cf (91% of inflow) | | | | | |\n| Center-of-Mass det. time= 50.3 min (783.0 - 732.6) | | | | | |\n| Volume | Invert | Avail.Storage | Storage Description | | |\n| #1 | 100.000' | 1,900.0 cf | Custom Stage Data (Conic) Listed below (Recalc) | | |\n| Elevation (feet) | Surf.Area (sq-ft) | Inc.Store (cubic-feet) | Cum.Store (cubic-feet) | Wet.Area (sq-ft) | |\n| 100.000 | 950 | 0.0 | 0.0 | 950 | |\n| 101.000 | 950 | 950.0 | 950.0 | 1,059 | |\n| 102.000 | 950 | 950.0 | 1,900.0 | 1,169 | |\n| Device | Routing | Invert | Outlet Devices | | |\n| #1 | Device 2 | 100.990' | 24.0\" W x 12.0\" H Vert. Orifice/Grate C= 0.600 | | |\n| #2 | Primary | 100.000' | 12.0\" Round Culvert | | |\n| | | | L= 150.00' CPP, projecting, no headwall, Ke= 0.900 | | |\n| | | | Inlet / Outlet Invert= 100.000' / 98.500' S= 0.0100' /' Cc= 0.900 | | |\n| | | | n= 0.011 Concrete pipe, straight & clean, Flow Area= 0.79 sf | | |\n| Primary OutFlow Max=3.25 cfs @ 12.11 hrs HW=101.687' TW=98.885' (Dynamic Tailwater) | | | | | |\n| 2=Culvert (Inlet Controls 3.25 cfs @ 4.14 fps) | | | | | |\n| 1=Orifice/Grate (Passes 3.25 cfs of 3.74 cfs potential flow) | | | | | |\n\nSource context and notes:\n\n# Stormwater Management Quantity and Quality Standards and Computations\n\nSource revision: January 2026.\n\n\n| Ex_5-8 NoExfiltration | | | | NOAA 24-hr C Proj_100yr Rainfall=12.46\" | |\n| --- | --- | --- | --- | --- | --- |\n| Prepared by NJDEP | | | | Printed 7/12/2023 | |\n| HydroCAD® 10.00-25 s/n 07311 © 2019 HydroCAD Software Solutions LLC | | | | Page 79 | |\n| Summary for Pond 34P: SS Bioretention S | | | | | |\n| Inflow Area = 10,890 sf,100.00% Impervious, Inflow Depth = 12.22\" for Proj_100yr event | | | | | |\n| Inflow = 3.66 cfs @ 12.09 hrs, Volume= 11,088.2 cf | | | | | |\n| Outflow = 3.25 cfs @ 12.11 hrs, Volume= 10,147.7 cf, Atten= 11%, Lag= 1.2 min | | | | | |\n| Primary = 3.25 cfs @ 12.11 hrs, Volume= 10,147.7 cf | | | | | |\n| Routing by Dyn-Stor-Ind method, Time Span= 0.00-36.00 hrs, dt= 0.01 hrs | | | | | |\n| Peak Elev= 101.687' @ 12.11 hrs Surf.Area= 950 sf Storage= 1,602.7 cf | | | | | |\n| Plug-Flow detention time= 97.2 min calculated for 10,144.8 cf (91% of inflow) | | | | | |\n| Center-of-Mass det. time= 50.3 min (783.0 - 732.6) | | | | | |\n| Volume | Invert | Avail.Storage | Storage Description | | |\n| #1 | 100.000' | 1,900.0 cf | Custom Stage Data (Conic) Listed below (Recalc) | | |\n| Elevation (feet) | Surf.Area (sq-ft) | Inc.Store (cubic-feet) | Cum.Store (cubic-feet) | Wet.Area (sq-ft) | |\n| 100.000 | 950 | 0.0 | 0.0 | 950 | |\n| 101.000 | 950 | 950.0 | 950.0 | 1,059 | |\n| 102.000 | 950 | 950.0 | 1,900.0 | 1,169 | |\n| Device | Routing | Invert | Outlet Devices | | |\n| #1 | Device 2 | 100.990' | 24.0\" W x 12.0\" H Vert. Orifice/Grate C= 0.600 | | |\n| #2 | Primary | 100.000' | 12.0\" Round Culvert | | |\n| | | | L= 150.00' CPP, projecting, no headwall, Ke= 0.900 | | |\n| | | | Inlet / Outlet Invert= 100.000' / 98.500' S= 0.0100' /' Cc= 0.900 | | |\n| | | | n= 0.011 Concrete pipe, straight & clean, Flow Area= 0.79 sf | | |\n| Primary OutFlow Max=3.25 cfs @ 12.11 hrs HW=101.687' TW=98.885' (Dynamic Tailwater) | | | | | |\n| 2=Culvert (Inlet Controls 3.25 cfs @ 4.14 fps) | | | | | |\n| 1=Orifice/Grate (Passes 3.25 cfs of 3.74 cfs potential flow) | | | | | |\n\n\nSource: HydroCAD® Summary Report; HydroCAD is a registered trademark of HydroCAD Software Solutions LLC. Used with permission.\n\n# Step 4: Calculate the Peak Flow Rates Allowed under the Stormwater Runoff Quantity Control Standards\n\nIn accordance with the 3rd option under N.J.A.C. 7:8-5.6(b), the proposed design must demonstrate that the post-construction peak runoff rates for the current and projected 2-, 10- and 100-year storm events, respectively, are 50, 75, and 80 percent, respectively, of the pre-construction peak runoff rates. Therefore, we must calculate the runoff volume and peak flow rate for the pre-construction condition in accordance with the land cover, soil type, and precipitation depths identified in Step 2, if choosing this option.\n\n[Source PDF](SOURCE.pdf#page=76)"}
{"metadata": {"source_document": "NJ BMP", "version_year": "2026", "chapter_subchapter": "Chapter 5", "citation": "BMP 2026, Ch 5, p. 77", "topic": "Table 45"}, "programmatic_checks": {}, "content_markdown": "# Stormwater Management Quantity and Quality Standards and Computations\n\n## Table 45\n\n| Pre-construction Condition | | | | |\n| --- | --- | --- | --- | --- |\n| Design Storm | Current Precipitation Peak Flow Rate (cfs) | | Projected Precipitation Peak Flow Rate (cfs) | |\n| | To be disturbed | Undisturbed | To be disturbed | Undisturbed |\n| 2-year | 0.19 | 0.05 | 0.49 | 0.12 |\n| 10-year | 1.40 | 0.35 | 2.35 | 0.59 |\n| 100-year | 5.61 | 1.40 | 9.75 | 2.44 |\n\nSource context and notes:\n\n# Stormwater Management Quantity and Quality Standards and Computations\n\nSource revision: January 2026.\n\n\n| Pre-construction Condition | | | | |\n| --- | --- | --- | --- | --- |\n| Design Storm | Current Precipitation Peak Flow Rate (cfs) | | Projected Precipitation Peak Flow Rate (cfs) | |\n| | To be disturbed | Undisturbed | To be disturbed | Undisturbed |\n| 2-year | 0.19 | 0.05 | 0.49 | 0.12 |\n| 10-year | 1.40 | 0.35 | 2.35 | 0.59 |\n| 100-year | 5.61 | 1.40 | 9.75 | 2.44 |\n\n\nThe peak rate reductions required, as stated above, are applied to the peak flow rates calculated for the disturbed areas, with the results shown below in the column \"Post-Construction Target.\" These values are summed with the peak flow rate for the undisturbed area to calculate the total allowable peak flow rate for each of the current and projected design storms.\n\n| Post-Construction Condition | | | | | | |\n| --- | --- | --- | --- | --- | --- | --- |\n| Design Storm | Current Precipitation Peak Flow Rate (cfs) | | | Projected Precipitation Peak Flow Rate (cfs) | | |\n| | Post-Construction Target | Undisturbed | Total Allowable | Post-Construction Target | Undisturbed | Total Allowable |\n| 2-year | 0.10 | 0.05 | 0.15 | 0.24 | 0.12 | 0.36 |\n| 10-year | 1.05 | 0.35 | 1.40 | 1.76 | 0.59 | 2.35 |\n| 100-year | 4.49 | 1.40 | 5.89 | 7.80 | 2.44 | 10.24 |\n\n# Step 5: Design the SSGI Infiltration Basins to meet the Quantity Control Standard\n\n[Source PDF](SOURCE.pdf#page=77)"}
{"metadata": {"source_document": "NJ BMP", "version_year": "2026", "chapter_subchapter": "Chapter 5", "citation": "BMP 2026, Ch 5, p. 77", "topic": "Table 46"}, "programmatic_checks": {}, "content_markdown": "# Stormwater Management Quantity and Quality Standards and Computations\n\n## Table 46\n\n| Post-Construction Condition | | | | | | |\n| --- | --- | --- | --- | --- | --- | --- |\n| Design Storm | Current Precipitation Peak Flow Rate (cfs) | | | Projected Precipitation Peak Flow Rate (cfs) | | |\n| | Post-Construction Target | Undisturbed | Total Allowable | Post-Construction Target | Undisturbed | Total Allowable |\n| 2-year | 0.10 | 0.05 | 0.15 | 0.24 | 0.12 | 0.36 |\n| 10-year | 1.05 | 0.35 | 1.40 | 1.76 | 0.59 | 2.35 |\n| 100-year | 4.49 | 1.40 | 5.89 | 7.80 | 2.44 | 10.24 |\n\nSource context and notes:\n\n| Design Storm | Current Precipitation Peak Flow Rate (cfs) | | Projected Precipitation Peak Flow Rate (cfs) | |\n| | To be disturbed | Undisturbed | To be disturbed | Undisturbed |\n| 2-year | 0.19 | 0.05 | 0.49 | 0.12 |\n| 10-year | 1.40 | 0.35 | 2.35 | 0.59 |\n| 100-year | 5.61 | 1.40 | 9.75 | 2.44 |\n\nThe peak rate reductions required, as stated above, are applied to the peak flow rates calculated for the disturbed areas, with the results shown below in the column \"Post-Construction Target.\" These values are summed with the peak flow rate for the undisturbed area to calculate the total allowable peak flow rate for each of the current and projected design storms.\n\n\n| Post-Construction Condition | | | | | | |\n| --- | --- | --- | --- | --- | --- | --- |\n| Design Storm | Current Precipitation Peak Flow Rate (cfs) | | | Projected Precipitation Peak Flow Rate (cfs) | | |\n| | Post-Construction Target | Undisturbed | Total Allowable | Post-Construction Target | Undisturbed | Total Allowable |\n| 2-year | 0.10 | 0.05 | 0.15 | 0.24 | 0.12 | 0.36 |\n| 10-year | 1.05 | 0.35 | 1.40 | 1.76 | 0.59 | 2.35 |\n| 100-year | 4.49 | 1.40 | 5.89 | 7.80 | 2.44 | 10.24 |\n\n\n# Step 5: Design the SSGI Infiltration Basins to meet the Quantity Control Standard\n\nTo meet the allowable peak runoff rates calculated in Step 4, two identical SSGI infiltration basins are designed to collect the clean roof runoff from the proposed building, the parking lot runoff that has been treated by the proposed SSGI bioretention BMPs and the runoff from the lawn areas. Each of the proposed two SSGI infiltration BMPs is designed with a 5,020 sf footprint and depth of 4.5 ft, meaning the top of the basin bottom surface is set at El. 95.50. The outlet structure of each proposed BMP consists of a 6-inch orifice, a 12-inch by 6-inch orifice, a 5 ft by 5 ft top broad-crested weir and a 12-inch culvert discharge pipe. Take note that the 6-inch orifice is set at EL. 97.10, or 1.60 ft above the bottom of the BMP to accommodate storage volume for the runoff that will provide groundwater recharge; recharge is discussed in Step 6. Routing calculations for both of the current and projected 100-year storms follow below.\n\n[Source PDF](SOURCE.pdf#page=77)"}
{"metadata": {"source_document": "NJ BMP", "version_year": "2026", "chapter_subchapter": "Chapter 5", "citation": "BMP 2026, Ch 5, p. 78", "topic": "Table 47"}, "programmatic_checks": {}, "content_markdown": "# Stormwater Management Quantity and Quality Standards and Computations\n\n## Table 47\n\n| Ex_5-8 NoExfiltration | | | | NOAA 24-hr C Adj_100_yr Rainfall=9.18\" | |\n| --- | --- | --- | --- | --- | --- |\n| Prepared by NJDEP | | | | Printed 7/12/2023 | |\n| HydroCAD® 10.00-25 s/n 07311 © 2019 HydroCAD Software Solutions LLC | | | | Page 21 | |\n| Summary for Pond 37P: SS Infiltration S | | | | | |\n| Inflow Area = 43,560 sf, 75.00% Impervious, Inflow Depth = 7.54\" for Adj_100_yr event | | | | | |\n| Inflow = 8.93 cfs @ 12.10 hrs, Volume= 27,360.8 cf | | | | | |\n| Outflow = 2.21 cfs @ 12.35 hrs, Volume= 19,168.6 cf, Atten= 75%, Lag= 15.0 min | | | | | |\n| Primary = 2.21 cfs @ 12.35 hrs, Volume= 19,168.6 cf | | | | | |\n| Routing by Dyn-Stor-Ind method, Time Span= 0.00-36.00 hrs, dt= 0.01 hrs | | | | | |\n| Peak Elev= 98.430' @ 12.35 hrs Surf.Area= 5,020 sf Storage= 14,710.2 cf | | | | | |\n| Plug-Flow detention time= 260.7 min calculated for 19,163.3 cf (70% of inflow) | | | | | |\n| Center-of-Mass det. time= 162.6 min ( 930.1 - 767.5 ) | | | | | |\n| Volume Invert Avail.Storage Storage Description | | | | | |\n| #1 95.500' 22,590.0 cf Custom Stage Data (Conic) Listed below (Recalc) | | | | | |\n| Elevation (feet) Surf.Area (sq-ft) Inc.Store (cubic-feet) Wet.Area (sq-ft) | | | | | |\n| 95.500 | 5,020 | 0.0 | 0.0 | 5,020 | |\n| 96.500 | 5,020 | 5,020.0 | 5,020.0 | 5,271 | |\n| 97.100 | 5,020 | 3,012.0 | 8,032.0 | 5,422 | |\n| 97.500 | 5,020 | 2,008.0 | 10,040.0 | 5,522 | |\n| 98.500 | 5,020 | 5,020.0 | 15,060.0 | 5,773 | |\n| 99.500 | 5,020 | 5,020.0 | 20,080.0 | 6,025 | |\n| 100.000 | 5,020 | 2,510.0 | 22,590.0 | 6,150 | |\n| Device Routing Invert Outlet Devices | | | | | |\n| #1 Device 4 99.300' 20.0' long x 0.5' breadth Broad-Crested Rectangular Weir | | | | | |\n| Head (feet) 0.200 0.400 0.600 0.800 1.000 | | | | | |\n| Coef. (English) 2.80 2.92 3.08 3.30 3.32 | | | | | |\n| #2 Device 4 97.900' 12.0\" W x 6.0\" H Vert. Orifice/Grate C= 0.600 | | | | | |\n| #3 Device 4 97.100' 6.0\" Vert. Orifice/Grate C= 0.600 | | | | | |\n| #4 Primary 95.500' 12.0\" Round Culvert | | | | | |\n| L= 50.00' RCP, groove end projecting, Ke= 0.200 | | | | | |\n| Inlet / Outlet Invert= 95.500' / 95.000' S= 0.0100' /' Cc= 0.900 | | | | | |\n| n= 0.011 Concrete pipe, straight & clean, Flow Area= 0.79 sf | | | | | |\n| Primary OutFlow Max=2.21 cfs @ 12.35 hrs HW=98.430' TW=94.000' (Dynamic Tailwater) | | | | | |\n| 4=Culvert (Passes 2.21 cfs of 6.45 cfs potential flow) | | | | | |\n| 1=Broad-Crested Rectangular Weir ( Controls 0.00 cfs) | | | | | |\n| 2=Orifice/Grate (Orifice Controls 1.22 cfs @ 2.45 fps) | | | | | |\n| 3=Orifice/Grate (Orifice Controls 0.98 cfs @ 5.00 fps) | | | | | |\n\nSource context and notes:\n\n# Stormwater Management Quantity and Quality Standards and Computations\n\nSource revision: January 2026.\n\n\n| Ex_5-8 NoExfiltration | | | | NOAA 24-hr C Adj_100_yr Rainfall=9.18\" | |\n| --- | --- | --- | --- | --- | --- |\n| Prepared by NJDEP | | | | Printed 7/12/2023 | |\n| HydroCAD® 10.00-25 s/n 07311 © 2019 HydroCAD Software Solutions LLC | | | | Page 21 | |\n| Summary for Pond 37P: SS Infiltration S | | | | | |\n| Inflow Area = 43,560 sf, 75.00% Impervious, Inflow Depth = 7.54\" for Adj_100_yr event | | | | | |\n| Inflow = 8.93 cfs @ 12.10 hrs, Volume= 27,360.8 cf | | | | | |\n| Outflow = 2.21 cfs @ 12.35 hrs, Volume= 19,168.6 cf, Atten= 75%, Lag= 15.0 min | | | | | |\n| Primary = 2.21 cfs @ 12.35 hrs, Volume= 19,168.6 cf | | | | | |\n| Routing by Dyn-Stor-Ind method, Time Span= 0.00-36.00 hrs, dt= 0.01 hrs | | | | | |\n| Peak Elev= 98.430' @ 12.35 hrs Surf.Area= 5,020 sf Storage= 14,710.2 cf | | | | | |\n| Plug-Flow detention time= 260.7 min calculated for 19,163.3 cf (70% of inflow) | | | | | |\n| Center-of-Mass det. time= 162.6 min ( 930.1 - 767.5 ) | | | | | |\n| Volume Invert Avail.Storage Storage Description | | | | | |\n| #1 95.500' 22,590.0 cf Custom Stage Data (Conic) Listed below (Recalc) | | | | | |\n| Elevation (feet) Surf.Area (sq-ft) Inc.Store (cubic-feet) Wet.Area (sq-ft) | | | | | |\n| 95.500 | 5,020 | 0.0 | 0.0 | 5,020 | |\n| 96.500 | 5,020 | 5,020.0 | 5,020.0 | 5,271 | |\n| 97.100 | 5,020 | 3,012.0 | 8,032.0 | 5,422 | |\n| 97.500 | 5,020 | 2,008.0 | 10,040.0 | 5,522 | |\n| 98.500 | 5,020 | 5,020.0 | 15,060.0 | 5,773 | |\n| 99.500 | 5,020 | 5,020.0 | 20,080.0 | 6,025 | |\n| 100.000 | 5,020 | 2,510.0 | 22,590.0 | 6,150 | |\n| Device Routing Invert Outlet Devices | | | | | |\n| #1 Device 4 99.300' 20.0' long x 0.5' breadth Broad-Crested Rectangular Weir | | | | | |\n| Head (feet) 0.200 0.400 0.600 0.800 1.000 | | | | | |\n| Coef. (English) 2.80 2.92 3.08 3.30 3.32 | | | | | |\n| #2 Device 4 97.900' 12.0\" W x 6.0\" H Vert. Orifice/Grate C= 0.600 | | | | | |\n| #3 Device 4 97.100' 6.0\" Vert. Orifice/Grate C= 0.600 | | | | | |\n| #4 Primary 95.500' 12.0\" Round Culvert | | | | | |\n| L= 50.00' RCP, groove end projecting, Ke= 0.200 | | | | | |\n| Inlet / Outlet Invert= 95.500' / 95.000' S= 0.0100' /' Cc= 0.900 | | | | | |\n| n= 0.011 Concrete pipe, straight & clean, Flow Area= 0.79 sf | | | | | |\n| Primary OutFlow Max=2.21 cfs @ 12.35 hrs HW=98.430' TW=94.000' (Dynamic Tailwater) | | | | | |\n| 4=Culvert (Passes 2.21 cfs of 6.45 cfs potential flow) | | | | | |\n| 1=Broad-Crested Rectangular Weir ( Controls 0.00 cfs) | | | | | |\n| 2=Orifice/Grate (Orifice Controls 1.22 cfs @ 2.45 fps) | | | | | |\n| 3=Orifice/Grate (Orifice Controls 0.98 cfs @ 5.00 fps) | | | | | |\n\n\nSource: HydroCAD® Summary Report; HydroCAD is a registered trademark of HydroCAD Software Solutions LLC. Used with permission.\n\n[Source PDF](SOURCE.pdf#page=78)"}
{"metadata": {"source_document": "NJ BMP", "version_year": "2026", "chapter_subchapter": "Chapter 5", "citation": "BMP 2026, Ch 5, p. 79", "topic": "Table 48"}, "programmatic_checks": {}, "content_markdown": "# Stormwater Management Quantity and Quality Standards and Computations\n\n## Table 48\n\n| Ex_5-8 NoExfiltration | | | | NOAA 24-hr C Proj_100yr Rainfall=12.46\" | |\n| --- | --- | --- | --- | --- | --- |\n| Prepared by NJDEP | | | | Printed 7/12/2023 | |\n| HydroCAD® 10.00-25 s/n 07311 © 2019 HydroCAD Software Solutions LLC | | | | Page 81 | |\n| Summary for Pond 37P: SS Infiltration S | | | | | |\n| Inflow Area = | 43,560 sf, 75.00% Impervious, Inflow Depth = 10.68\" for Proj_100yr event | | | | |\n| Inflow = | 12.23 cfs @ 12.10 hrs, Volume= 38,779.8 cf | | | | |\n| Outflow = | 3.83 cfs @ 12.31 hrs, Volume= 30,582.7 cf, Atten= 69%, Lag= 12.4 min | | | | |\n| Primary = | 3.83 cfs @ 12.31 hrs, Volume= 30,582.7 cf | | | | |\n| Routing by Dyn-Stor-Ind method, Time Span= 0.00-36.00 hrs, dt= 0.01 hrs | | | | | |\n| Peak Elev= 99.257' @ 12.31 hrs Surf.Area= 5,020 sf Storage= 18,860.1 cf | | | | | |\n| Plug-Flow detention time= 218.6 min calculated for 30,574.3 cf (79% of inflow) | | | | | |\n| Center-of-Mass det. time= 135.5 min (897.7 - 762.2) | | | | | |\n| Volume | Invert | Avail.Storage | Storage Description | | |\n| #1 | 95.500' | 22,590.0 cf | Custom Stage Data (Conic) Listed below (Recalc) | | |\n| Elevation (feet) | Surf.Area (sq-ft) | Inc.Store (cubic-feet) | Cum.Store (cubic-feet) | Wet.Area (sq-ft) | |\n| 95.500 | 5,020 | 0.0 | 0.0 | 5,020 | |\n| 96.500 | 5,020 | 5,020.0 | 5,020.0 | 5,271 | |\n| 97.100 | 5,020 | 3,012.0 | 8,032.0 | 5,422 | |\n| 97.500 | 5,020 | 2,008.0 | 10,040.0 | 5,522 | |\n| 98.500 | 5,020 | 5,020.0 | 15,060.0 | 5,773 | |\n| 99.500 | 5,020 | 5,020.0 | 20,080.0 | 6,025 | |\n| 100.000 | 5,020 | 2,510.0 | 22,590.0 | 6,150 | |\n| Device | Routing | Invert | Outlet Devices | | |\n| #1 | Device 4 | 99.300' | 20.0' long x 0.5' breadth Broad-Crested Rectangular Weir | | |\n| | | | Head (feet) 0.200 0.400 0.600 0.800 1.000 | | |\n| | | | Coef. (English) 2.80 2.92 3.08 3.30 3.32 | | |\n| #2 | Device 4 | 97.900' | 12.0\" W x 6.0\" H Vert. Orifice/Grate C= 0.600 | | |\n| #3 | Device 4 | 97.100' | 6.0\" Vert. Orifice/Grate C= 0.600 | | |\n| #4 | Primary | 95.500' | 12.0\" Round Culvert | | |\n| | | | L= 50.00' RCP, groove end projecting, Ke= 0.200 | | |\n| | | | Inlet / Outlet Invert= 95.500' / 95.000' S= 0.0100' /' C= 0.900 | | |\n| | | | n= 0.011 Concrete pipe, straight & clean, Flow Area= 0.79 sf | | |\n| Primary OutFlow Max=3.83 cfs @ 12.31 hrs HW=99.257' TW=94.000' (Dynamic Tailwater) | | | | | |\n| 4= Culvert (Passes 3.83 cfs of 7.46 cfs potential flow) | | | | | |\n| 1= Broad-Crested Rectangular Weir (Controls 0.00 cfs) | | | | | |\n| 2= Orifice/Grate (Orifice Controls 2.53 cfs @ 5.06 fps) | | | | | |\n| 3= Orifice/Grate (Orifice Controls 1.31 cfs @ 6.65 fps) | | | | | |\n\nSource context and notes:\n\n# Stormwater Management Quantity and Quality Standards and Computations\n\nSource revision: January 2026.\n\n\n| Ex_5-8 NoExfiltration | | | | NOAA 24-hr C Proj_100yr Rainfall=12.46\" | |\n| --- | --- | --- | --- | --- | --- |\n| Prepared by NJDEP | | | | Printed 7/12/2023 | |\n| HydroCAD® 10.00-25 s/n 07311 © 2019 HydroCAD Software Solutions LLC | | | | Page 81 | |\n| Summary for Pond 37P: SS Infiltration S | | | | | |\n| Inflow Area = | 43,560 sf, 75.00% Impervious, Inflow Depth = 10.68\" for Proj_100yr event | | | | |\n| Inflow = | 12.23 cfs @ 12.10 hrs, Volume= 38,779.8 cf | | | | |\n| Outflow = | 3.83 cfs @ 12.31 hrs, Volume= 30,582.7 cf, Atten= 69%, Lag= 12.4 min | | | | |\n| Primary = | 3.83 cfs @ 12.31 hrs, Volume= 30,582.7 cf | | | | |\n| Routing by Dyn-Stor-Ind method, Time Span= 0.00-36.00 hrs, dt= 0.01 hrs | | | | | |\n| Peak Elev= 99.257' @ 12.31 hrs Surf.Area= 5,020 sf Storage= 18,860.1 cf | | | | | |\n| Plug-Flow detention time= 218.6 min calculated for 30,574.3 cf (79% of inflow) | | | | | |\n| Center-of-Mass det. time= 135.5 min (897.7 - 762.2) | | | | | |\n| Volume | Invert | Avail.Storage | Storage Description | | |\n| #1 | 95.500' | 22,590.0 cf | Custom Stage Data (Conic) Listed below (Recalc) | | |\n| Elevation (feet) | Surf.Area (sq-ft) | Inc.Store (cubic-feet) | Cum.Store (cubic-feet) | Wet.Area (sq-ft) | |\n| 95.500 | 5,020 | 0.0 | 0.0 | 5,020 | |\n| 96.500 | 5,020 | 5,020.0 | 5,020.0 | 5,271 | |\n| 97.100 | 5,020 | 3,012.0 | 8,032.0 | 5,422 | |\n| 97.500 | 5,020 | 2,008.0 | 10,040.0 | 5,522 | |\n| 98.500 | 5,020 | 5,020.0 | 15,060.0 | 5,773 | |\n| 99.500 | 5,020 | 5,020.0 | 20,080.0 | 6,025 | |\n| 100.000 | 5,020 | 2,510.0 | 22,590.0 | 6,150 | |\n| Device | Routing | Invert | Outlet Devices | | |\n| #1 | Device 4 | 99.300' | 20.0' long x 0.5' breadth Broad-Crested Rectangular Weir | | |\n| | | | Head (feet) 0.200 0.400 0.600 0.800 1.000 | | |\n| | | | Coef. (English) 2.80 2.92 3.08 3.30 3.32 | | |\n| #2 | Device 4 | 97.900' | 12.0\" W x 6.0\" H Vert. Orifice/Grate C= 0.600 | | |\n| #3 | Device 4 | 97.100' | 6.0\" Vert. Orifice/Grate C= 0.600 | | |\n| #4 | Primary | 95.500' | 12.0\" Round Culvert | | |\n| | | | L= 50.00' RCP, groove end projecting, Ke= 0.200 | | |\n| | | | Inlet / Outlet Invert= 95.500' / 95.000' S= 0.0100' /' C= 0.900 | | |\n| | | | n= 0.011 Concrete pipe, straight & clean, Flow Area= 0.79 sf | | |\n| Primary OutFlow Max=3.83 cfs @ 12.31 hrs HW=99.257' TW=94.000' (Dynamic Tailwater) | | | | | |\n| 4= Culvert (Passes 3.83 cfs of 7.46 cfs potential flow) | | | | | |\n| 1= Broad-Crested Rectangular Weir (Controls 0.00 cfs) | | | | | |\n| 2= Orifice/Grate (Orifice Controls 2.53 cfs @ 5.06 fps) | | | | | |\n| 3= Orifice/Grate (Orifice Controls 1.31 cfs @ 6.65 fps) | | | | | |\n\n\nSource: HydroCAD® Summary Report; HydroCAD is a registered trademark of HydroCAD Software Solutions LLC. Used with permission.\n\nTake note that the configuration of outlets shown above is just one example of the many possible configurations and outlet designs. Designers and reviewers shall not interpret the design and arrangement shown in the routing calculations literally.\n\nThe post-construction runoff peak rates to be discharged offsite, including the discharges from the proposed SSGI infiltration BMP and the runoff from the undisturbed woods, have been added as text to the routing diagram provided below. Note that the peak flow rate from each element, or \"node,\" cannot be arithmetically added to calculate the total discharge from the site, i.e., Node 7L, because the time to peak for each element is different. The post construction runoff peak flow rates for the off-site discharges are also provided in the next table.\n\n[Source PDF](SOURCE.pdf#page=79)"}
{"metadata": {"source_document": "NJ BMP", "version_year": "2026", "chapter_subchapter": "Chapter 5", "citation": "BMP 2026, Ch 5, p. 80", "topic": "Table 49"}, "programmatic_checks": {}, "content_markdown": "# Stormwater Management Quantity and Quality Standards and Computations\n\n## Table 49\n\n| Post-Construction Condition Off-Site Discharges | | | | |\n| --- | --- | --- | --- | --- |\n| Design Storm | Current Precipitation Peak Flow Rate (cfs) | | Projected Precipitation Peak Flow Rate (cfs) | |\n| | Total Allowable | Discharge From the Site | Total Allowable | Discharge From the Site |\n| 2-year | 0.15 | 0.05 | 0.36 | 0.12 |\n| 10-year | 1.40 | 0.58 | 2.35 | 1.45 |\n| 100-year | 5.89 | 5.81 | 10.24 | 10.09 |\n\nSource context and notes:\n\n# Stormwater Management Quantity and Quality Standards and Computations\n\nSource revision: January 2026.\n\nRouting Diagram with Current and Projected Peak Flow Rates Superimposed\n[Figure: img-34.jpeg (original PDF, p. 80)](SOURCE.pdf#page=80)\n\n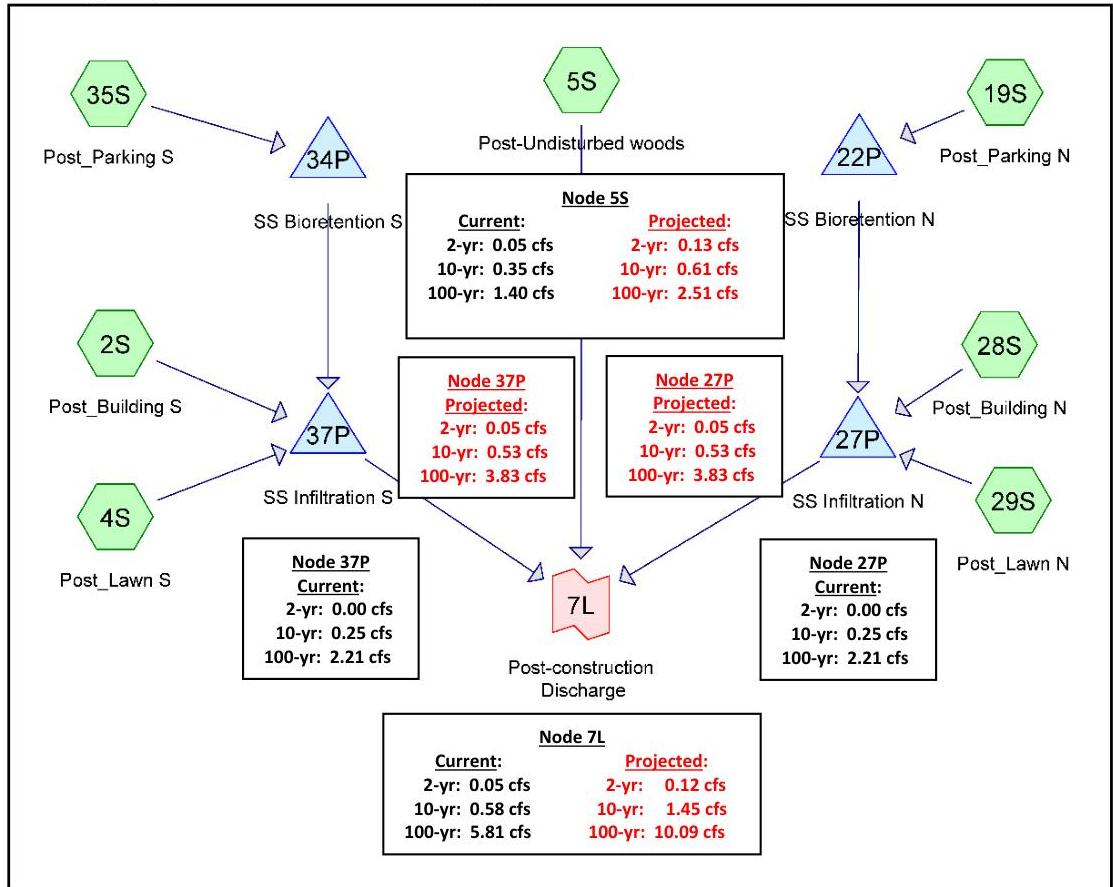\nSource: HydroCAD® Diagram; HydroCAD is a registered trademark of HydroCAD Software Solutions LLC. Used with permission. Each numbered element is called a \"node.\"\n\n\n| Post-Construction Condition Off-Site Discharges | | | | |\n| --- | --- | --- | --- | --- |\n| Design Storm | Current Precipitation Peak Flow Rate (cfs) | | Projected Precipitation Peak Flow Rate (cfs) | |\n| | Total Allowable | Discharge From the Site | Total Allowable | Discharge From the Site |\n| 2-year | 0.15 | 0.05 | 0.36 | 0.12 |\n| 10-year | 1.40 | 0.58 | 2.35 | 1.45 |\n| 100-year | 5.89 | 5.81 | 10.24 | 10.09 |\n\n\n# Step 6: Demonstrate Compliance with the Groundwater Recharge Standards\n\nThe design demonstrates that the increase in stormwater runoff volume from the pre-construction to the post-construction condition for the projected 2-year storm is infiltrated through the proposed SSGI bioretention BMPs and SSGI infiltration BMPs. The projected 2-year design storm, with a precipitation depth of 3.93 inches, will produce the pre- and post-construction condition runoff volumes noted below:\n\n[Source PDF](SOURCE.pdf#page=80)\n\nOCR images on the cited PDF pages (page association only): [p. 80, image 1](images/page-0080-img-01.jpg)"}
{"metadata": {"source_document": "NJ BMP", "version_year": "2026", "chapter_subchapter": "Chapter 5", "citation": "BMP 2026, Ch 5, p. 81", "topic": "Table 50"}, "programmatic_checks": {}, "content_markdown": "# Stormwater Management Quantity and Quality Standards and Computations\n\n## Table 50\n\n| Pre-construction Condition | Post-construction Condition | Increase |\n| --- | --- | --- |\n| 4,557 cf | 22,443 cf | 17,886 cf |\n\nSource context and notes:\n\n# Stormwater Management Quantity and Quality Standards and Computations\n\nSource revision: January 2026.\n\n\n| Pre-construction Condition | Post-construction Condition | Increase |\n| --- | --- | --- |\n| 4,557 cf | 22,443 cf | 17,886 cf |\n\n\nEach of the SSGI bioretention BMPs provides an infiltration volume of 939 cf (rounding up from 938.9) below the first orifice. Therefore, the SSGI infiltration basins have to provide a total of 16,008 cf, which means 8,004 cf in each BMP. Each SSGI infiltration BMP is designed with a footprint of 5,020 sf. With the bottom of the SSGI infiltration basin set at EL. 95.50, the lowest orifice of the basin is set at 1.60 ft above the bottom of the BMP, which places the orifice at EL. 97.10 in order to provide sufficient storage volume for the runoff to be infiltrated. A summary report from the modeling software of the proposed SSGI infiltration basin follows.\n\nSummary Report for the Projected 2-year Storm\n\n| Ex_5-8 NoExfiltration NOAA 24-hr C Proj_2yr Rainfall=3.93\" | | | | | |\n| --- | --- | --- | --- | --- | --- |\n| Prepared by NJDEP | | | | | Printed 7/12/2023 |\n| HydroCAD® 10.00-25 s/n 07311 © 2019 HydroCAD Software Solutions LLC | | | | | Page 121 |\n| Summary for Pond 37P: SS Infiltration S | | | | | |\n| Inflow Area = 43,560 sf, 75.00% Impervious, Inflow Depth = 2.71\" for Proj_2yr event | | | | | |\n| Inflow = 3.44 cfs @ 12.10 hrs, Volume= 9,825.2 cf | | | | | |\n| Outflow = 0.05 cfs @ 20.38 hrs, Volume= 1,648.9 cf, Atten= 99%, Lag= 496.9 min | | | | | |\n| Primary = 0.05 cfs @ 20.38 hrs, Volume= 1,648.9 cf | | | | | |\n| Routing by Dyn-Stor-Ind method, Time Span= 0.00-36.00 hrs, dt= 0.01 hrs | | | | | |\n| Peak Elev= 97.227 @ 20.38 hrs Surf.Area= 5,020 sf Storage= 8,670.1 cf | | | | | |\n| Plug-Flow detention time= 815.0 min calculated for 1,648.9 cf (17% of inflow) | | | | | |\n| Center-of-Mass det. time= 557.5 min (1,339.8 - 782.2) | | | | | |\n| Volume Invert Avail.Storage Storage Description | | | | | |\n| #1 95.500' 22,590.0 cf Custom Stage Data (Conic) Listed below (Recalc) | | | | | |\n| Elevation (feet) Surf.Area (sq-ft) Inc.Store (cubic-feet) Cum.Store (cubic-feet) Wet.Area (sq-ft) | | | | | |\n| 95.500 5,020 0.0 0.0 5,020 | | | | | |\n| 96.500 5,020 5,020.0 5,020.0 5,271 | | | | | |\n| 97.100 5,020 3,012.0 8,032.0 5,422 | | | | | |\n| 97.500 5,020 2,008.0 10,040.0 5,522 | | | | | |\n| 98.500 5,020 5,020.0 15,060.0 5,773 | | | | | |\n| 99.500 5,020 5,020.0 20,080.0 6,025 | | | | | |\n| 100.000 5,020 2,510.0 22,590.0 6,150 | | | | | |\n| Device Routing Invert Outlet Devices | | | | | |\n| #1 Device 4 99.300' 20.0\" long x 0.5\" breadth Broad-Crested Rectangular Weir | | | | | |\n| Head (feet) 0.200 0.400 0.600 0.800 1.000 | | | | | |\n| Coef. (English) 2.80 2.92 3.08 3.30 3.32 | | | | | |\n| #2 Device 4 97.900' 12.0\" W x 6.0\" H Vert. Orifice/Grate C= 0.600 | | | | | |\n| #3 Device 4 97.100' 6.0\" Vert. Orifice/Grate C= 0.600 | | | | | |\n| #4 Primary 95.500' 12.0\" Round Culvert | | | | | |\n| L= 50.00' RCP, groove end projecting, Ke= 0.200 | | | | | |\n| Inlet / Outlet Invert= 95.500' / 95.000' S= 0.0100' /' Cc= 0.900 | | | | | |\n| n= 0.011 Concrete pipe, straight & clean, Flow Area= 0.79 sf | | | | | |\n| Primary OutFlow Max=0.05 cfs @ 20.38 hrs HW=97.227\" TW=94.000' (Dynamic Tailwater) | | | | | |\n| 4=Culvert (Passes 0.05 cfs of 4.58 cfs potential flow) | | | | | |\n| 1=Broad-Crested Rectangular Weir (Controls 0.00 cfs) | | | | | |\n| 2=Orifice/Grate (Controls 0.00 cfs) | | | | | |\n| 3=Orifice/Grate (Orifice Controls 0.05 cfs @ 1.21 fps) | | | | | |\n\n[Source PDF](SOURCE.pdf#page=81)"}
{"metadata": {"source_document": "NJ BMP", "version_year": "2026", "chapter_subchapter": "Chapter 5", "citation": "BMP 2026, Ch 5, p. 81", "topic": "Table 51"}, "programmatic_checks": {}, "content_markdown": "# Stormwater Management Quantity and Quality Standards and Computations\n\n## Table 51\n\n| Ex_5-8 NoExfiltration NOAA 24-hr C Proj_2yr Rainfall=3.93\" | | | | | |\n| --- | --- | --- | --- | --- | --- |\n| Prepared by NJDEP | | | | | Printed 7/12/2023 |\n| HydroCAD® 10.00-25 s/n 07311 © 2019 HydroCAD Software Solutions LLC | | | | | Page 121 |\n| Summary for Pond 37P: SS Infiltration S | | | | | |\n| Inflow Area = 43,560 sf, 75.00% Impervious, Inflow Depth = 2.71\" for Proj_2yr event | | | | | |\n| Inflow = 3.44 cfs @ 12.10 hrs, Volume= 9,825.2 cf | | | | | |\n| Outflow = 0.05 cfs @ 20.38 hrs, Volume= 1,648.9 cf, Atten= 99%, Lag= 496.9 min | | | | | |\n| Primary = 0.05 cfs @ 20.38 hrs, Volume= 1,648.9 cf | | | | | |\n| Routing by Dyn-Stor-Ind method, Time Span= 0.00-36.00 hrs, dt= 0.01 hrs | | | | | |\n| Peak Elev= 97.227 @ 20.38 hrs Surf.Area= 5,020 sf Storage= 8,670.1 cf | | | | | |\n| Plug-Flow detention time= 815.0 min calculated for 1,648.9 cf (17% of inflow) | | | | | |\n| Center-of-Mass det. time= 557.5 min (1,339.8 - 782.2) | | | | | |\n| Volume Invert Avail.Storage Storage Description | | | | | |\n| #1 95.500' 22,590.0 cf Custom Stage Data (Conic) Listed below (Recalc) | | | | | |\n| Elevation (feet) Surf.Area (sq-ft) Inc.Store (cubic-feet) Cum.Store (cubic-feet) Wet.Area (sq-ft) | | | | | |\n| 95.500 5,020 0.0 0.0 5,020 | | | | | |\n| 96.500 5,020 5,020.0 5,020.0 5,271 | | | | | |\n| 97.100 5,020 3,012.0 8,032.0 5,422 | | | | | |\n| 97.500 5,020 2,008.0 10,040.0 5,522 | | | | | |\n| 98.500 5,020 5,020.0 15,060.0 5,773 | | | | | |\n| 99.500 5,020 5,020.0 20,080.0 6,025 | | | | | |\n| 100.000 5,020 2,510.0 22,590.0 6,150 | | | | | |\n| Device Routing Invert Outlet Devices | | | | | |\n| #1 Device 4 99.300' 20.0\" long x 0.5\" breadth Broad-Crested Rectangular Weir | | | | | |\n| Head (feet) 0.200 0.400 0.600 0.800 1.000 | | | | | |\n| Coef. (English) 2.80 2.92 3.08 3.30 3.32 | | | | | |\n| #2 Device 4 97.900' 12.0\" W x 6.0\" H Vert. Orifice/Grate C= 0.600 | | | | | |\n| #3 Device 4 97.100' 6.0\" Vert. Orifice/Grate C= 0.600 | | | | | |\n| #4 Primary 95.500' 12.0\" Round Culvert | | | | | |\n| L= 50.00' RCP, groove end projecting, Ke= 0.200 | | | | | |\n| Inlet / Outlet Invert= 95.500' / 95.000' S= 0.0100' /' Cc= 0.900 | | | | | |\n| n= 0.011 Concrete pipe, straight & clean, Flow Area= 0.79 sf | | | | | |\n| Primary OutFlow Max=0.05 cfs @ 20.38 hrs HW=97.227\" TW=94.000' (Dynamic Tailwater) | | | | | |\n| 4=Culvert (Passes 0.05 cfs of 4.58 cfs potential flow) | | | | | |\n| 1=Broad-Crested Rectangular Weir (Controls 0.00 cfs) | | | | | |\n| 2=Orifice/Grate (Controls 0.00 cfs) | | | | | |\n| 3=Orifice/Grate (Orifice Controls 0.05 cfs @ 1.21 fps) | | | | | |\n\nSource context and notes:\n\n| Pre-construction Condition | Post-construction Condition | Increase |\n| --- | --- | --- |\n| 4,557 cf | 22,443 cf | 17,886 cf |\n\nEach of the SSGI bioretention BMPs provides an infiltration volume of 939 cf (rounding up from 938.9) below the first orifice. Therefore, the SSGI infiltration basins have to provide a total of 16,008 cf, which means 8,004 cf in each BMP. Each SSGI infiltration BMP is designed with a footprint of 5,020 sf. With the bottom of the SSGI infiltration basin set at EL. 95.50, the lowest orifice of the basin is set at 1.60 ft above the bottom of the BMP, which places the orifice at EL. 97.10 in order to provide sufficient storage volume for the runoff to be infiltrated. A summary report from the modeling software of the proposed SSGI infiltration basin follows.\n\nSummary Report for the Projected 2-year Storm\n\n\n| Ex_5-8 NoExfiltration NOAA 24-hr C Proj_2yr Rainfall=3.93\" | | | | | |\n| --- | --- | --- | --- | --- | --- |\n| Prepared by NJDEP | | | | | Printed 7/12/2023 |\n| HydroCAD® 10.00-25 s/n 07311 © 2019 HydroCAD Software Solutions LLC | | | | | Page 121 |\n| Summary for Pond 37P: SS Infiltration S | | | | | |\n| Inflow Area = 43,560 sf, 75.00% Impervious, Inflow Depth = 2.71\" for Proj_2yr event | | | | | |\n| Inflow = 3.44 cfs @ 12.10 hrs, Volume= 9,825.2 cf | | | | | |\n| Outflow = 0.05 cfs @ 20.38 hrs, Volume= 1,648.9 cf, Atten= 99%, Lag= 496.9 min | | | | | |\n| Primary = 0.05 cfs @ 20.38 hrs, Volume= 1,648.9 cf | | | | | |\n| Routing by Dyn-Stor-Ind method, Time Span= 0.00-36.00 hrs, dt= 0.01 hrs | | | | | |\n| Peak Elev= 97.227 @ 20.38 hrs Surf.Area= 5,020 sf Storage= 8,670.1 cf | | | | | |\n| Plug-Flow detention time= 815.0 min calculated for 1,648.9 cf (17% of inflow) | | | | | |\n| Center-of-Mass det. time= 557.5 min (1,339.8 - 782.2) | | | | | |\n| Volume Invert Avail.Storage Storage Description | | | | | |\n| #1 95.500' 22,590.0 cf Custom Stage Data (Conic) Listed below (Recalc) | | | | | |\n| Elevation (feet) Surf.Area (sq-ft) Inc.Store (cubic-feet) Cum.Store (cubic-feet) Wet.Area (sq-ft) | | | | | |\n| 95.500 5,020 0.0 0.0 5,020 | | | | | |\n| 96.500 5,020 5,020.0 5,020.0 5,271 | | | | | |\n| 97.100 5,020 3,012.0 8,032.0 5,422 | | | | | |\n| 97.500 5,020 2,008.0 10,040.0 5,522 | | | | | |\n| 98.500 5,020 5,020.0 15,060.0 5,773 | | | | | |\n| 99.500 5,020 5,020.0 20,080.0 6,025 | | | | | |\n| 100.000 5,020 2,510.0 22,590.0 6,150 | | | | | |\n| Device Routing Invert Outlet Devices | | | | | |\n| #1 Device 4 99.300' 20.0\" long x 0.5\" breadth Broad-Crested Rectangular Weir | | | | | |\n| Head (feet) 0.200 0.400 0.600 0.800 1.000 | | | | | |\n| Coef. (English) 2.80 2.92 3.08 3.30 3.32 | | | | | |\n| #2 Device 4 97.900' 12.0\" W x 6.0\" H Vert. Orifice/Grate C= 0.600 | | | | | |\n| #3 Device 4 97.100' 6.0\" Vert. Orifice/Grate C= 0.600 | | | | | |\n| #4 Primary 95.500' 12.0\" Round Culvert | | | | | |\n| L= 50.00' RCP, groove end projecting, Ke= 0.200 | | | | | |\n| Inlet / Outlet Invert= 95.500' / 95.000' S= 0.0100' /' Cc= 0.900 | | | | | |\n| n= 0.011 Concrete pipe, straight & clean, Flow Area= 0.79 sf | | | | | |\n| Primary OutFlow Max=0.05 cfs @ 20.38 hrs HW=97.227\" TW=94.000' (Dynamic Tailwater) | | | | | |\n| 4=Culvert (Passes 0.05 cfs of 4.58 cfs potential flow) | | | | | |\n| 1=Broad-Crested Rectangular Weir (Controls 0.00 cfs) | | | | | |\n| 2=Orifice/Grate (Controls 0.00 cfs) | | | | | |\n| 3=Orifice/Grate (Orifice Controls 0.05 cfs @ 1.21 fps) | | | | | |\n\n\nSource: HydroCAD® Summary Report; HydroCAD is a registered trademark of HydroCAD Software Solutions LLC. Used with permission.\n\n[Source PDF](SOURCE.pdf#page=81)"}
{"metadata": {"source_document": "NJ BMP", "version_year": "2026", "chapter_subchapter": "Chapter 5", "citation": "BMP 2026, Ch 5, p. 82", "topic": "Table 52"}, "programmatic_checks": {}, "content_markdown": "# Stormwater Management Quantity and Quality Standards and Computations\n\n## Table 52\n\n| Input Values | | | | | | | | |\n| --- | --- | --- | --- | --- | --- | --- | --- | --- |\n| 1.00 | R | Recharge rate (permeability rate) (in/hr) | | | | | | |\n| 0.150 | Sy | Specific yield, Sy (dimensionless) | | | | | | |\n| | | default value is 0.15; max value is 0.2 provided that a lab test data is submitted | | | | | | |\n| 1.00 | Kh | Horizontal hydraulic conductivity (in/hr) | | | | | | |\n| | | Kh = 5xRecharge Rate (R) in the costal plan; Kh=R outside the coastal plan | | | | | | |\n| 20.000 | x | 1/2 length of basin (x direction, in feet) | | | | | | |\n| 11.875 | y | 1/2 width of basin (y direction, in feet) | | | | | | |\n| 11.86 | t | Duration of infiltration period (hours) | | | | | | |\n| 10.00 | hi(0) | Initial thickness of saturated zone (feet) | | | | | | |\n| | | | | | | | | |\n| 15.222 | h(max) | Maximum thickness of saturated zone (beneath center of basin at end of infiltration period) | | | | | | |\n| 9.222 | Δh(max) | Maximum groundwater mounding (beneath center of basin at end of infiltration period) | | | | | | |\n\nSource context and notes:\n\n- ½ of the BMP width = 11.875 ft (half of the width)\n\nThe duration of infiltration period is equal to the volume of infiltrated runoff divided by the product of the BMP footprint and the recharge rate, and the calculation includes a conversion factor for converting inches to feet.\n\n## Duration of\n\nInfiltration Period = 11.86 hour = $$\\frac{939\\ cf}{\\left[950\\ sf\\ x\\left(1\\frac{in}{hr}\\ x\\ \\frac{1\\ ft}{12\\ in}\\right)\\right]}$$\n\n\n| Input Values | | | | | | | | |\n| --- | --- | --- | --- | --- | --- | --- | --- | --- |\n| 1.00 | R | Recharge rate (permeability rate) (in/hr) | | | | | | |\n| 0.150 | Sy | Specific yield, Sy (dimensionless) | | | | | | |\n| | | default value is 0.15; max value is 0.2 provided that a lab test data is submitted | | | | | | |\n| 1.00 | Kh | Horizontal hydraulic conductivity (in/hr) | | | | | | |\n| | | Kh = 5xRecharge Rate (R) in the costal plan; Kh=R outside the coastal plan | | | | | | |\n| 20.000 | x | 1/2 length of basin (x direction, in feet) | | | | | | |\n| 11.875 | y | 1/2 width of basin (y direction, in feet) | | | | | | |\n| 11.86 | t | Duration of infiltration period (hours) | | | | | | |\n| 10.00 | hi(0) | Initial thickness of saturated zone (feet) | | | | | | |\n| | | | | | | | | |\n| 15.222 | h(max) | Maximum thickness of saturated zone (beneath center of basin at end of infiltration period) | | | | | | |\n| 9.222 | Δh(max) | Maximum groundwater mounding (beneath center of basin at end of infiltration period) | | | | | | |\n\n\nThe results in the above graphic taken from the Hantush Spreadsheet show the groundwater mounding height is 5.222 ft above the seasonal high water table (SHWT). Given the condition that the existing grade at the location of the SSGI bioretention BMP is at EL. 103.00 and that the SHWT is located 13 ft below the basin bottom (basin invert), the top of the groundwater mounding is at EL. 95.222 (EL. 103.00 - 13 ft + 5.222 ft). Therefore, the mounding in the\n\n[Source PDF](SOURCE.pdf#page=82)"}
{"metadata": {"source_document": "NJ BMP", "version_year": "2026", "chapter_subchapter": "Chapter 5", "citation": "BMP 2026, Ch 5, p. 83", "topic": "Table 53"}, "programmatic_checks": {}, "content_markdown": "# Stormwater Management Quantity and Quality Standards and Computations\n\n## Table 53\n\n| Input Values | | | | | | | | | |\n| --- | --- | --- | --- | --- | --- | --- | --- | --- | --- |\n| 1.00 | R | Recharge rate (permeability rate) (in/hr) | | | | | | | |\n| 0.150 | Sy | Specific yield, Sy (dimensionless)
default value is 0.15; max value is 0.2 provided that a lab test data is submitted | | | | | | | |\n| 1.00 | Kh | Horizontal hydraulic conductivity (in/hr)
Kh = 5xRecharge Rate (R) in the coastal plain: Kh=R outside the coastal plain | | | | | | | |\n| 62.750 | x | 1/2 length of basin (x direction, in feet) | | | | | | | |\n| 20.000 | y | 1/2 width of basin (y direction, in feet) | | | | | | | |\n| 19.20 | t | Duration of infiltration period (hours) | | | | | | | |\n| 10.00 | hi(0) | Initial thickness of saturated zone (feet) | | | | | | | |\n| 19.464 | h(max) | Maximum thickness of saturated zone (beneath center of basin at end of infiltration period) | | | | | | | |\n| 9.464 | Δh(max) | Maximum groundwater mounding (beneath center of basin at end of infiltration period) | | | | | | | |\n\nSource context and notes:\n\nHorizontal hydraulic conductivity = 1 inch/hour (outside the coastal plan)\n\n$\\frac{1}{2}$ of the BMP length = 62.75 ft (half of the length)\n\n$\\frac{1}{2}$ of the BMP width = 20.00 ft (half of the length)\n\nDuration of infiltration period = 19.2 hour = $\\frac{8,032\\ cf}{\\left[5,020\\ sf\\ x\\left(1\\frac{in}{hr}x\\ \\frac{1ft}{12in}\\right)\\right]}$\n\n\n| Input Values | | | | | | | | | |\n| --- | --- | --- | --- | --- | --- | --- | --- | --- | --- |\n| 1.00 | R | Recharge rate (permeability rate) (in/hr) | | | | | | | |\n| 0.150 | Sy | Specific yield, Sy (dimensionless)
default value is 0.15; max value is 0.2 provided that a lab test data is submitted | | | | | | | |\n| 1.00 | Kh | Horizontal hydraulic conductivity (in/hr)
Kh = 5xRecharge Rate (R) in the coastal plain: Kh=R outside the coastal plain | | | | | | | |\n| 62.750 | x | 1/2 length of basin (x direction, in feet) | | | | | | | |\n| 20.000 | y | 1/2 width of basin (y direction, in feet) | | | | | | | |\n| 19.20 | t | Duration of infiltration period (hours) | | | | | | | |\n| 10.00 | hi(0) | Initial thickness of saturated zone (feet) | | | | | | | |\n| 19.464 | h(max) | Maximum thickness of saturated zone (beneath center of basin at end of infiltration period) | | | | | | | |\n| 9.464 | Δh(max) | Maximum groundwater mounding (beneath center of basin at end of infiltration period) | | | | | | | |\n\n\nThe result shows that the mounding height is 9.46 ft above the SHWT, which places the mounding height at EL. 97.46. However, the bottom surface of the BMP is at EL. 96.0. The mounding of the groundwater table caused by the proposed BMP will therefore affect the infiltration of the runoff.\n\nThe next step is to adjust the duration of infiltration period and proportionally reduce the recharge rate. Increasing the duration of infiltration period to be 72 hours will require the recharge rate be proportionally reduced to 0.27 inches/hour. The mounding height becomes 6.97 ft, which is at EL. 94.97. The mounding analysis demonstrates that a mounding in the groundwater table caused by the proposed infiltration of runoff is below the bottom surface of the BMP at EL. 96.0 when the duration of infiltration is extended to 72 hours. Since the\n\n[Source PDF](SOURCE.pdf#page=83)"}
{"metadata": {"source_document": "NJ BMP", "version_year": "2026", "chapter_subchapter": "Chapter 5", "citation": "BMP 2026, Ch 5, p. 84", "topic": "Table 54"}, "programmatic_checks": {}, "content_markdown": "# Stormwater Management Quantity and Quality Standards and Computations\n\n## Table 54\n\n| Input Values | | | | | |\n| --- | --- | --- | --- | --- | --- |\n| 0.27 | R | Recharge rate (permeability rate) (in/hr) | | | |\n| 0.150 | Sy | Specific yield, Sy (dimensionless) default value is 0.15; max value is 0.2 provided that a lab test data is submitted | | | |\n| 1.00 | Kh | Horizontal hydraulic conductivity (in/hr) Kh = 5xRecharge Rate (R) in the coastal plain: Kh=R outside the coastal plain | | | |\n| 62.750 | x | 1/2 length of basin (x direction, in feet) | | | |\n| 20.000 | y | 1/2 width of basin (y direction, in feet) | | | |\n| 72.00 | t | Duration of infiltration period (hours) | | | |\n| 10.00 | hi(0) | Initial thickness of saturated zone (feet) | | | |\n| | | | | | |\n| 16.967 | h(max) | Maximum thickness of saturated zone (beneath center of basin at end of infiltration period) | | | |\n| 6.967 | Δh(max) | Maximum groundwater mounding (beneath center of basin at end of infiltration period) | | | |\n\nSource context and notes:\n\n# Stormwater Management Quantity and Quality Standards and Computations\n\nSource revision: January 2026.\n\nduration of infiltration is within the maximum drain downtime of 72 hours, the result of the mounding analysis is acceptable.\n\n\n| Input Values | | | | | |\n| --- | --- | --- | --- | --- | --- |\n| 0.27 | R | Recharge rate (permeability rate) (in/hr) | | | |\n| 0.150 | Sy | Specific yield, Sy (dimensionless) default value is 0.15; max value is 0.2 provided that a lab test data is submitted | | | |\n| 1.00 | Kh | Horizontal hydraulic conductivity (in/hr) Kh = 5xRecharge Rate (R) in the coastal plain: Kh=R outside the coastal plain | | | |\n| 62.750 | x | 1/2 length of basin (x direction, in feet) | | | |\n| 20.000 | y | 1/2 width of basin (y direction, in feet) | | | |\n| 72.00 | t | Duration of infiltration period (hours) | | | |\n| 10.00 | hi(0) | Initial thickness of saturated zone (feet) | | | |\n| | | | | | |\n| 16.967 | h(max) | Maximum thickness of saturated zone (beneath center of basin at end of infiltration period) | | | |\n| 6.967 | Δh(max) | Maximum groundwater mounding (beneath center of basin at end of infiltration period) | | | |\n\n\nThe above calculations and designs show how to use the current precipitation depth and the projected precipitation depth to demonstrate compliance with the Stormwater Management rules.\n\n# Example 5-9: Calculate the Peak Flow Rate for Sizing a Manufactured Treatment Device Treating the WQDS from a 0.25-acre Impervious Motor Vehicle Surface\n\nThe following parameters apply for a site located in Mercer County:\n\n[Source PDF](SOURCE.pdf#page=84)"}
{"metadata": {"source_document": "NJ BMP", "version_year": "2026", "chapter_subchapter": "Chapter 5", "citation": "BMP 2026, Ch 5, p. 85", "topic": "Table 5-4: Summary of Modeling Guidance for Various Site Conditions"}, "programmatic_checks": {}, "content_markdown": "# Stormwater Management Quantity and Quality Standards and Computations\n\n## Table 5-4: Summary of Modeling Guidance for Various Site Conditions\n\n| Site Condition or Parameter | NRCS Methodology |\n| --- | --- |\n| Applicability | Peak flow rate, runoff volume, hydrograph comparison, sizing inflow rate and volume of BMPs |\n| Groundwater Recharge | Difference of Runoff volumes of pre- and post-construction projected 2-year storms |\n| Mixture of pervious and directly connected impervious surfaces | Calculate the runoff from impervious surface and pervious surface separately |\n| Unconnected impervious surface | NEH Part 630, Chapter 9 unconnected impervious surface (less than 30%) or NJ DEP Two-Step Technique |\n| Runoff Parameters | Curve Numbers from NEH, Part 630, Chapter 9 |\n| Rainfall Data | Use either NOAA precipitation data or NRCS County average rainfall data, as follows:
- Apply current precipitation adjustment factors to the rainfall data for the current design storms for both the pre- and post-construction conditions
- Apply future precipitation change factors to the rainfall data and calculate the projected precipitation depths for the projected design storms for both the pre- and post-construction conditions NJDEP Water Quality Design Storm rainfall is 1.25 inches in 2 hours |\n| Pre-construction Time of Concentration | Assume sheet flow length = 100 ft, unless a physical condition exists that shortens the sheet flow length to less than 100 ft
Maximum sheet flow roughness coefficient n = 0.40 |\n| Post-construction Time of Concentration | There is no minimum value for T_{c}
An assumed T_{c} value may not be used
Maximum Sheet flow length is 100 feet or the length calculated by McCuen-Spiess limitation, whichever is smaller
Maximum sheet flow roughness coefficient n = 0.40 |\n\nSource context and notes:\n\nSource revision: January 2026.\n\n# Guidance Summary\n\nThe following table summarizes how the methods discussed in this chapter may be used to meet the various requirements established in N.J.A.C. 7:8.\n\nTable 5-4: Summary of Modeling Guidance for Various Site Conditions\n\n\n| Site Condition or Parameter | NRCS Methodology |\n| --- | --- |\n| Applicability | Peak flow rate, runoff volume, hydrograph comparison, sizing inflow rate and volume of BMPs |\n| Groundwater Recharge | Difference of Runoff volumes of pre- and post-construction projected 2-year storms |\n| Mixture of pervious and directly connected impervious surfaces | Calculate the runoff from impervious surface and pervious surface separately |\n| Unconnected impervious surface | NEH Part 630, Chapter 9 unconnected impervious surface (less than 30%) or NJ DEP Two-Step Technique |\n| Runoff Parameters | Curve Numbers from NEH, Part 630, Chapter 9 |\n| Rainfall Data | Use either NOAA precipitation data or NRCS County average rainfall data, as follows:
- Apply current precipitation adjustment factors to the rainfall data for the current design storms for both the pre- and post-construction conditions
- Apply future precipitation change factors to the rainfall data and calculate the projected precipitation depths for the projected design storms for both the pre- and post-construction conditions NJDEP Water Quality Design Storm rainfall is 1.25 inches in 2 hours |\n| Pre-construction Time of Concentration | Assume sheet flow length = 100 ft, unless a physical condition exists that shortens the sheet flow length to less than 100 ft
Maximum sheet flow roughness coefficient n = 0.40 |\n| Post-construction Time of Concentration | There is no minimum value for T_{c}
An assumed T_{c} value may not be used
Maximum Sheet flow length is 100 feet or the length calculated by McCuen-Spiess limitation, whichever is smaller
Maximum sheet flow roughness coefficient n = 0.40 |\n\n\n\n[Source PDF](SOURCE.pdf#page=85)"}