Extracted images: Groundwater Recharge
Printed revision: July 2023.
Back to source | Original PDF | Image metadata
Original Mistral crops are preserved byte for byte. A crop can be a figure, table, equation, or other visual; no visual content is inferred as a numerical rule. Record and table associations use the same PDF page unless a direct image placeholder is identified. Nearby OCR excerpts are context, not verified captions.
PDF page 2, image 1
Mistral ID: img-0.jpeg. Extraction bundle(s): 2026_BMP_6_Groundwater_Recharge. Original page | Image file
Surrounding OCR excerpt:
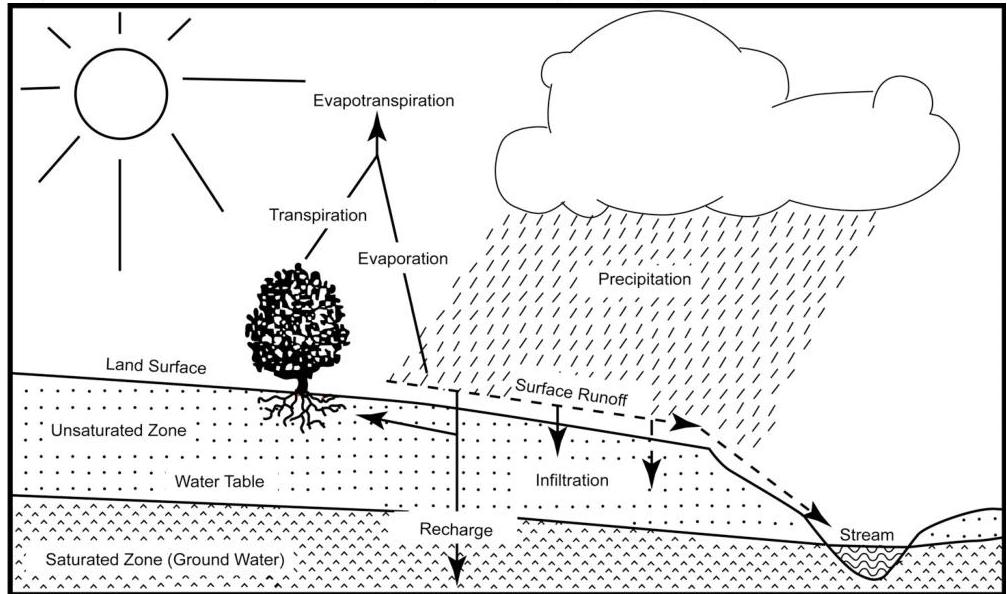
he soil's saturated zone and become groundwater. The role of groundwater recharge in the overall hydrologic cycle is illustrated in Figure 6-1 below.

Figure 6-1: Groundwater Recharge in the Hydrologic Cycle
[OCR image]
Source: New Jersey Geological Survey Report GSR-32.
PDF page 6, image 1
Mistral ID: img-1.jpeg. Extraction bundle(s): 2026_BMP_6_Groundwater_Recharge. Original page | Image file
Surrounding OCR excerpt:
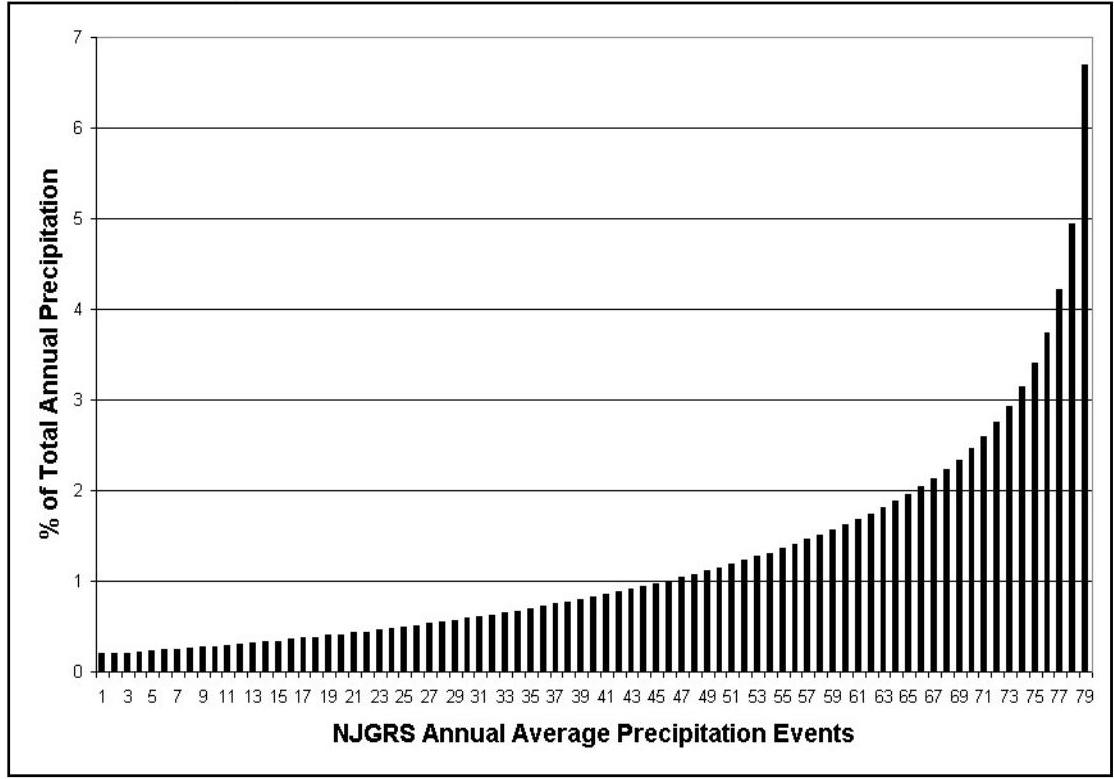
alues for each New Jersey municipality, the NJGRS user can generate this site-specific average annual design series simply by specifying the municipality and county in which the development site is located.

[OCR image]
Figure 6-2: Average Annual Precipitation Series in NJGRS
PDF page 7, image 1
Mistral ID: img-2.jpeg. Extraction bundle(s): 2026_BMP_6_Groundwater_Recharge. Original page | Image file
Surrounding OCR excerpt:
[OCR image]
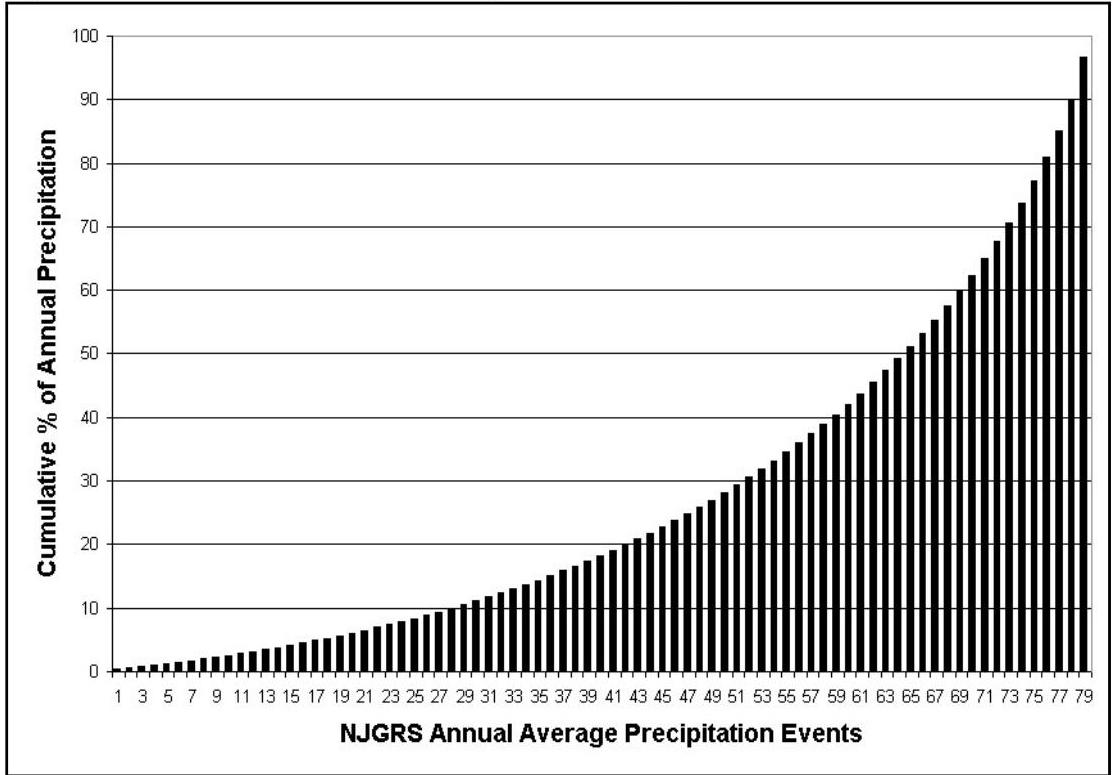
Figure 6-3: Cumulative Total of Average Annual Precipitation Series in NJGRS

Once an average annual design series is computed for the specific recharge BMP site, the NJGRS next addresses the problem of precipitation losses. As noted above, all of the possible losses that will occur, from the time the precipitation falls on the BMP's impervious contributory drainage area to when the recharged water move
PDF page 13, image 1
Mistral ID: img-3.jpeg. Extraction bundle(s): 2026_BMP_6_Groundwater_Recharge. Original page | Image file
Surrounding OCR excerpt:
[OCR image]
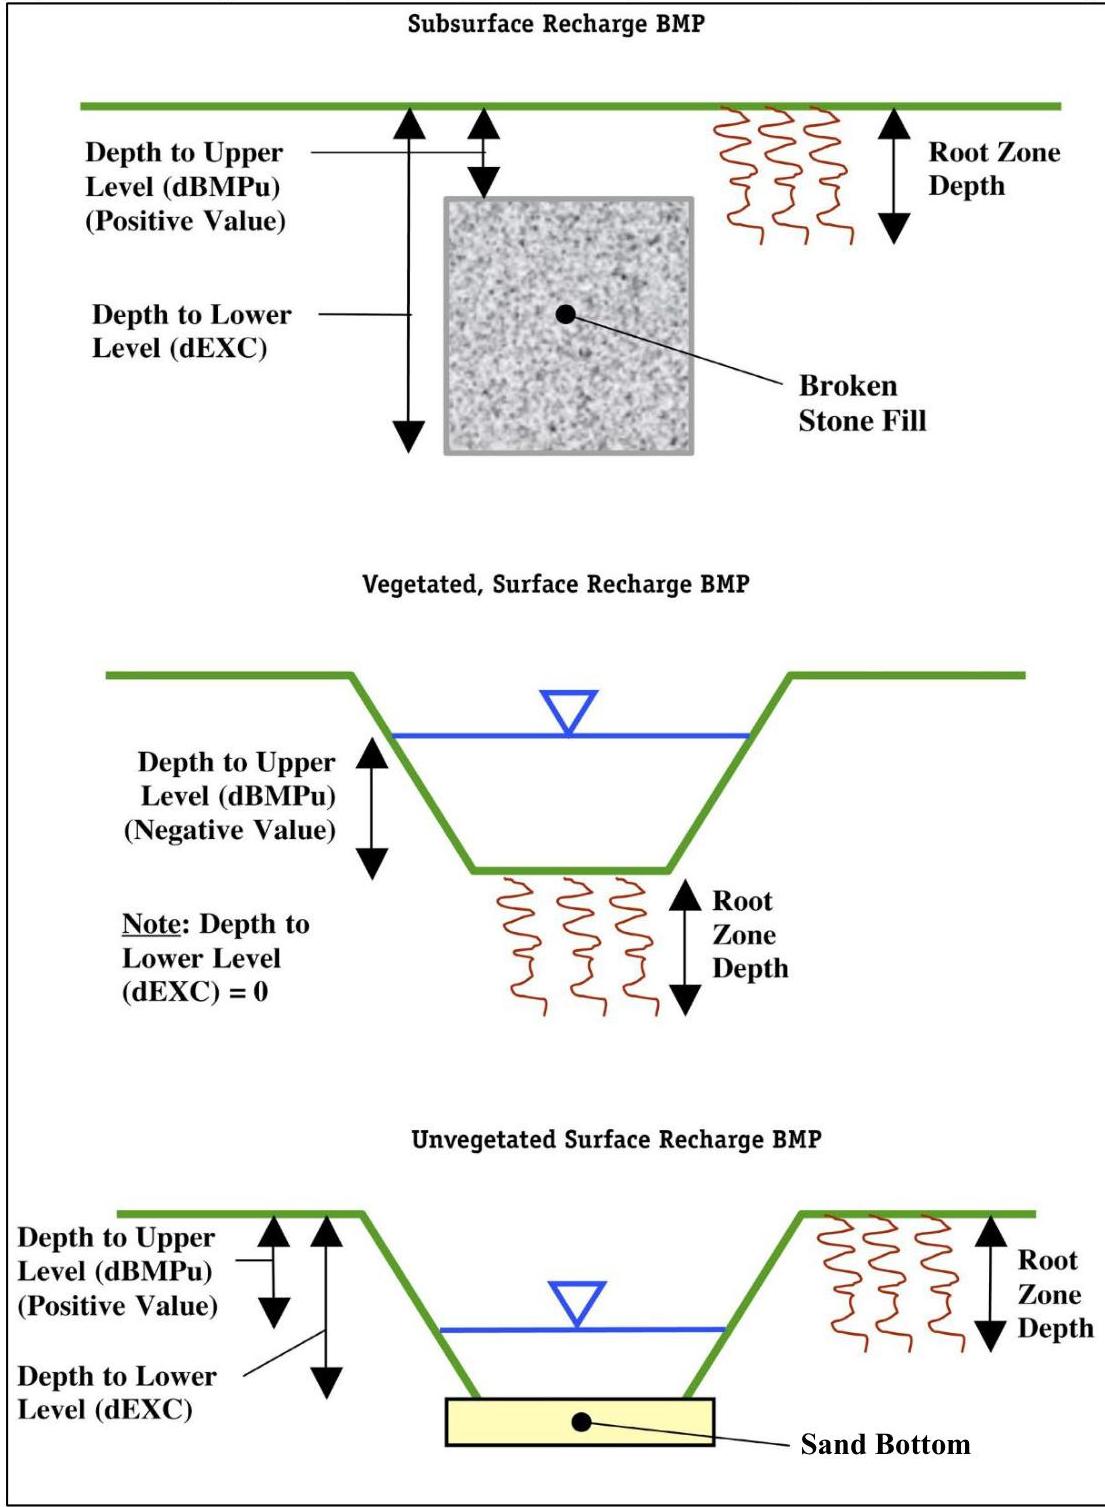
Figure 6-4: Examples of Depths to Upper (dBMPu) and Lower (dEXC) Levels of Recharge BMP

In using the BMP Calculations worksheet, it is important to note that, by default, the NJGRS takes the values from the Annual Recharge worksheet for the Post-Development Recharge Deficit Volume (Cell K24) and the Total Impervious Area (Cell M23) and specifies them as initial values on the BMP Calculations worksheet