Extracted images: Green Roofs (Small-Scale GI)
Printed revision: January 2026.
Back to source | Original PDF | Image metadata
Original Mistral crops are preserved byte for byte. A crop can be a figure, table, equation, or other visual; no visual content is inferred as a numerical rule. Record and table associations use the same PDF page unless a direct image placeholder is identified. Nearby OCR excerpts are context, not verified captions.
PDF page 1, image 1
Mistral ID: img-0.jpeg. Extraction bundle(s): 2026_BMP_9_4_Green_Roofs. Original page | Image file
Tables on the same PDF page: Table 1
Surrounding OCR excerpt:
# 9.4 GREEN ROOFS

[OCR image]

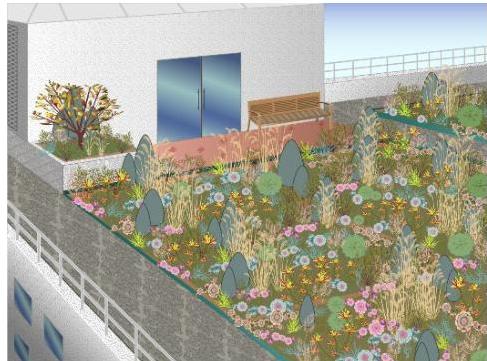
A green roof, also known as a vegetated roof, is a roof that has been covered with a growing medium and vegetation. Green roofs are effective for reducing the amount of stormwater runoff leaving a site. A green roof consists of vegetation planted in growing media on top of a drainage layer that intercepts stormwater runoff and reduces the total volume of runoff through evapotranspiration.

|  N.J.A.C.
PDF page 2, image 1
Mistral ID: img-1.jpeg. Extraction bundle(s): 2026_BMP_9_4_Green_Roofs. Original page | Image file
Surrounding OCR excerpt:
event alteration or removal.

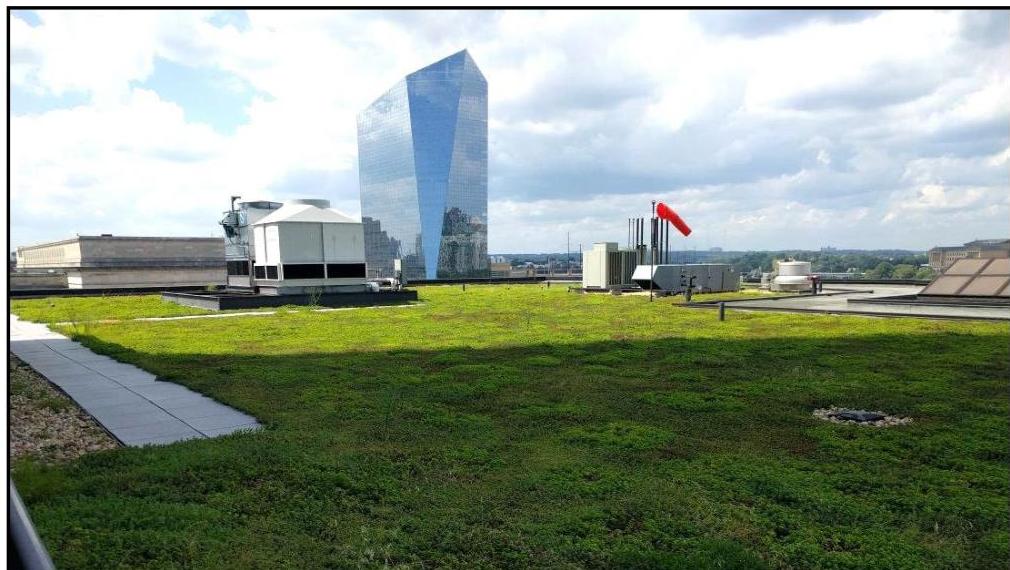
The following series of images depict the variety of vegetation that used on a green roof. Like the main area of the green roof shown below, low-lying vegetation can be planted

[OCR image]
PDF page 3, image 1
Mistral ID: img-2.jpeg. Extraction bundle(s): 2026_BMP_9_4_Green_Roofs. Original page | Image file
Surrounding OCR excerpt:
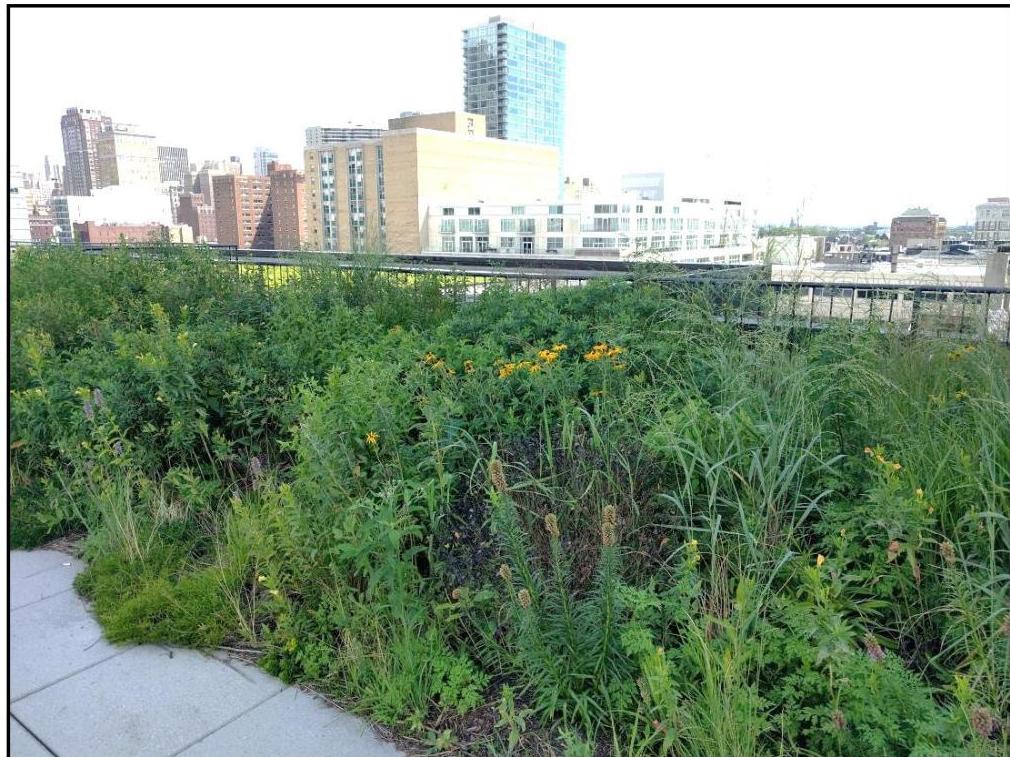
or a variety of taller plants can also be used, like that shown below.

[OCR image]

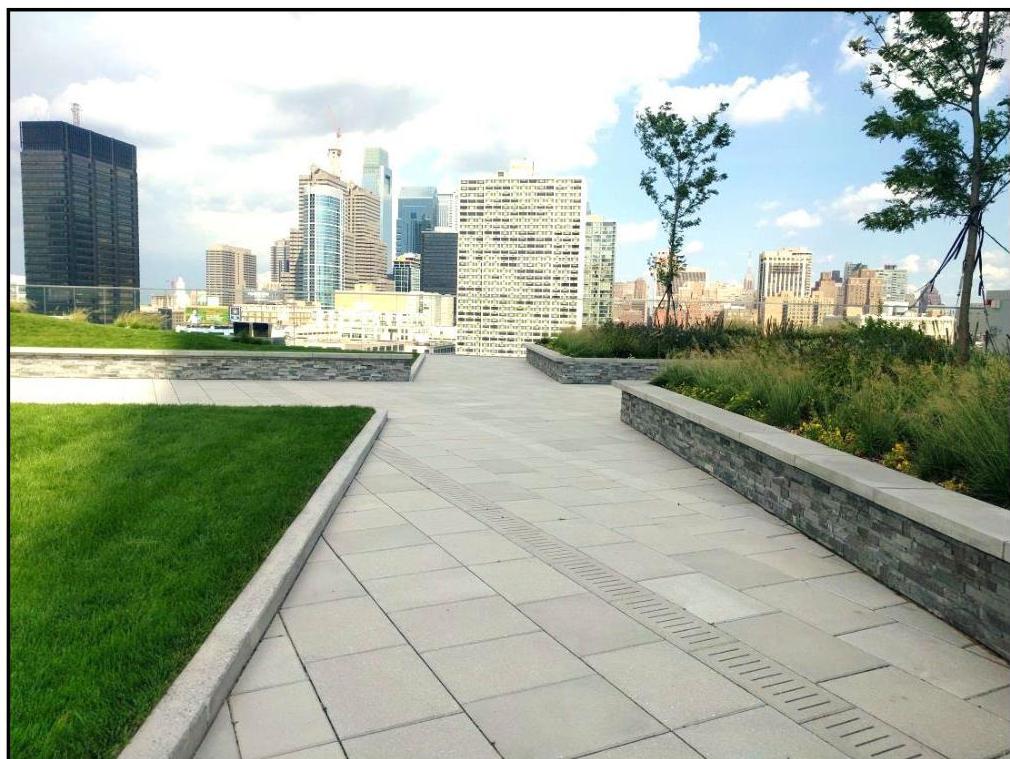
It is even possible to use turf grass or trees on a green roof. The photo below shows an example of a green roof with both.

[OCR image]
PDF page 3, image 2
Mistral ID: img-3.jpeg. Extraction bundle(s): 2026_BMP_9_4_Green_Roofs. Original page | Image file
Surrounding OCR excerpt:
taller plants can also be used, like that shown below.

[OCR image]

It is even possible to use turf grass or trees on a green roof. The photo below shows an example of a green roof with both.

[OCR image]
PDF page 4, image 1
Mistral ID: img-4.jpeg. Extraction bundle(s): 2026_BMP_9_4_Green_Roofs. Original page | Image file
Surrounding OCR excerpt:
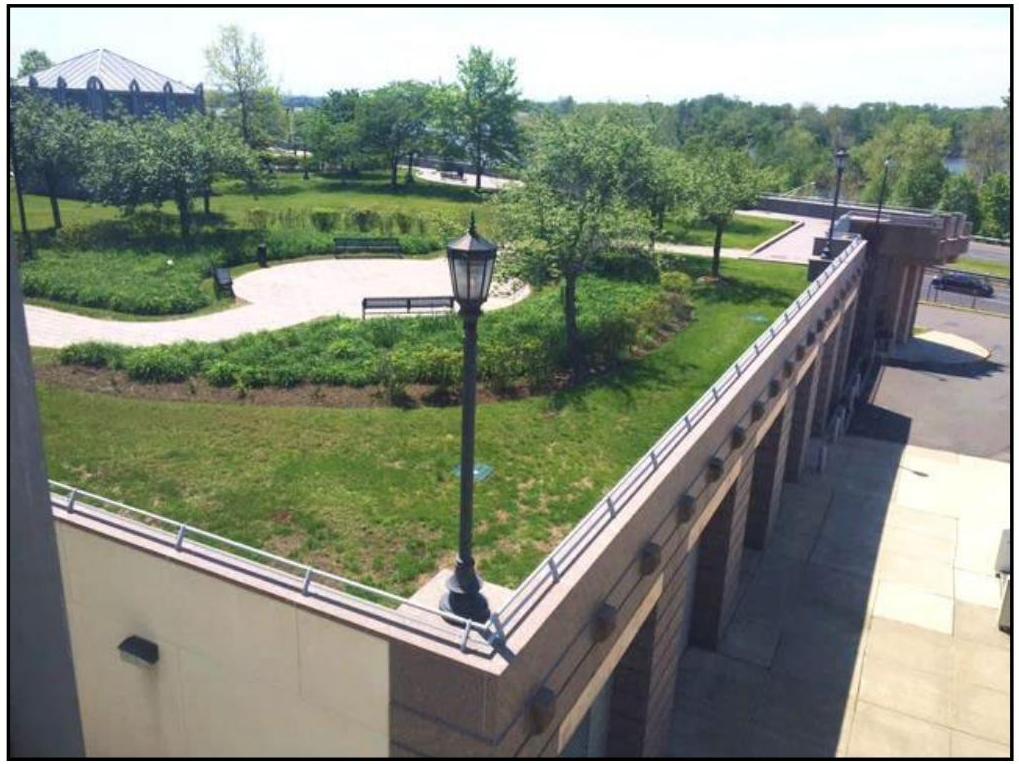
Here is another example of a green roof incorporating a wide variety of plants.

[OCR image]

## Applications

[OCR image]

Pursuant to N.J.A.C. 7:8-5.2(a)(2), the minimum design and performance standards for groundwater recharge, stormwater runoff quality and stormwater quantity at N.J.A.C. 7:8-5.4, 5.5 and 5.6 shall be met by incorporating green infrastructure in accordance with N.J.A.C. 7:8-5.3.

[OCR image]

Green roofs may be designed to convey storm events larg
PDF page 4, image 2
Mistral ID: img-5.jpeg. Extraction bundle(s): 2026_BMP_9_4_Green_Roofs. Original page | Image file

Surrounding OCR excerpt:
Here is another example of a green roof incorporating a wide variety of plants.

[OCR image]

## Applications

[OCR image]

Pursuant to N.J.A.C. 7:8-5.2(a)(2), the minimum design and performance standards for groundwater recharge, stormwater runoff quality and stormwater quantity at N.J.A.C. 7:8-5.4, 5.5 and 5.6 shall be met by incorporating green infrastructure in accordance with N.J.A.C. 7:8-5.3.

[OCR image]

Green roofs may be designed to convey storm events larger than the Water Quality Design Storm (WQDS
PDF page 4, image 3
Mistral ID: img-6.jpeg. Extraction bundle(s): 2026_BMP_9_4_Green_Roofs. Original page | Image file

Surrounding OCR excerpt:
standards for groundwater recharge, stormwater runoff quality and stormwater quantity at N.J.A.C. 7:8-5.4, 5.5 and 5.6 shall be met by incorporating green infrastructure in accordance with N.J.A.C. 7:8-5.3.

[OCR image]

Green roofs may be designed to convey storm events larger than the Water Quality Design Storm (WQDS); however, regardless of the design storm chosen, all green roofs must be designed for stability and capacity in accordance with the Standards for Soil Erosion and Sediment Control in New Jersey, as required by N.J.A.C. 7:8 Stormwater Management rules.

Green roofs may be designed to reduce peak runoff r
PDF page 5, image 1
Mistral ID: img-7.jpeg. Extraction bundle(s): 2026_BMP_9_4_Green_Roofs. Original page | Image file
Surrounding OCR excerpt:
Layer Requirements

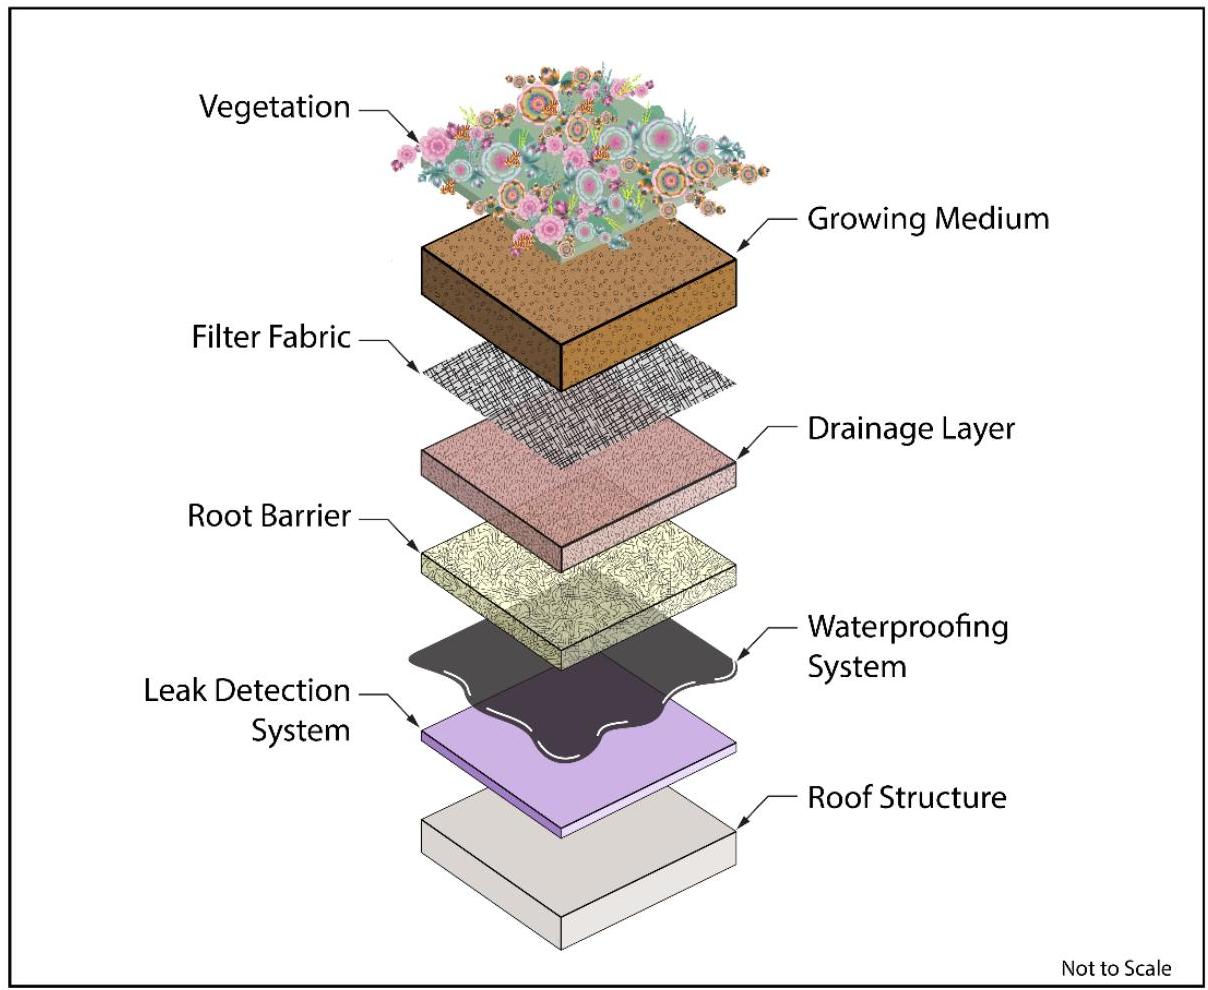
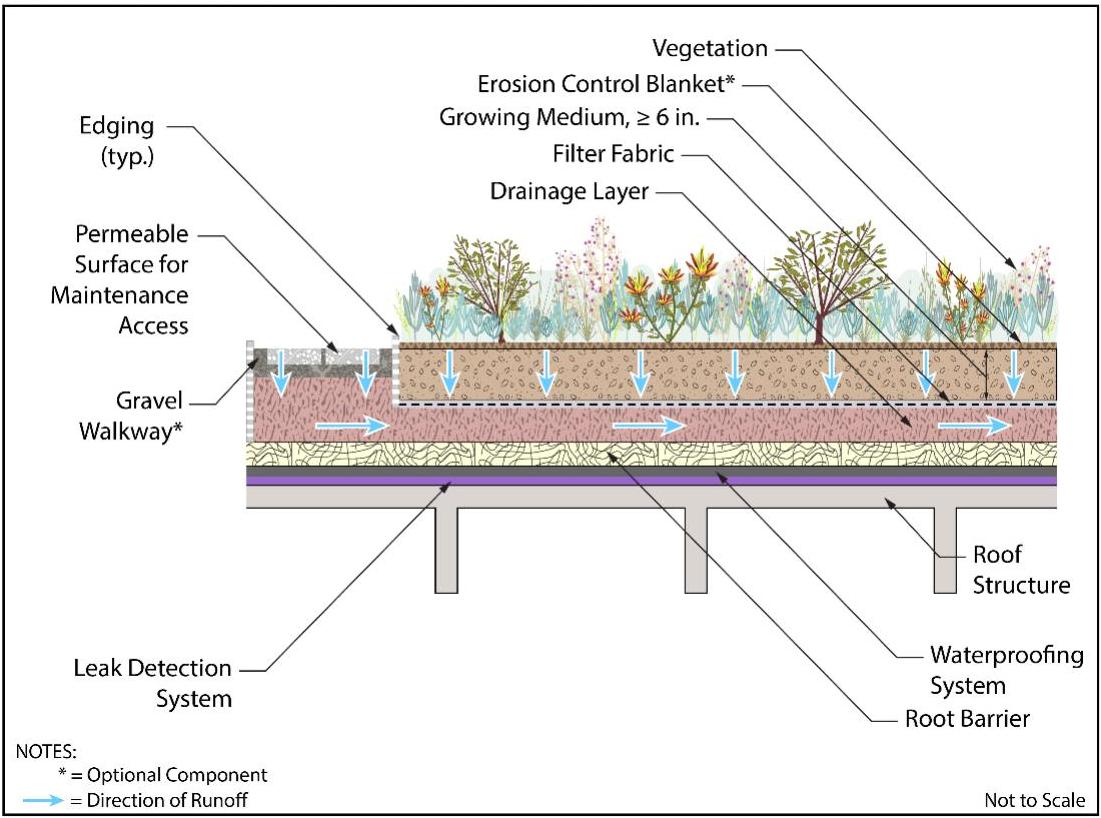
The following illustration depicts the various component layers typically incorporated into a green roof. Each layer is discussed in the text below and continues further through Page 8.

[OCR image]
PDF page 8, image 1
Mistral ID: img-8.jpeg. Extraction bundle(s): 2026_BMP_9_4_Green_Roofs. Original page | Image file
Surrounding OCR excerpt:
ty of adverse impacts, including erosion and flooding in down-gradient areas.
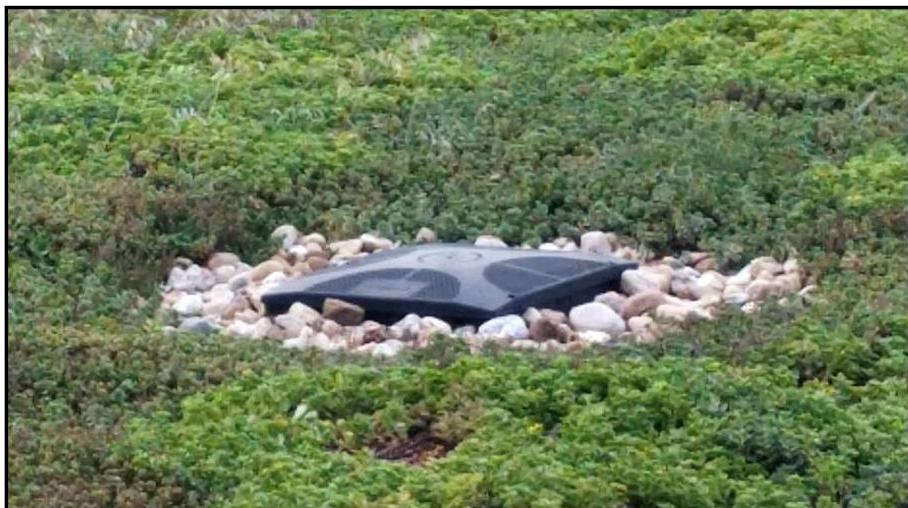
- All drains and scuppers must be protected to prevent clogging; one such method is a gravel apron, as shown in the image below.

[OCR image]
PDF page 9, image 1
Mistral ID: img-9.jpeg. Extraction bundle(s): 2026_BMP_9_4_Green_Roofs. Original page | Image file
Surrounding OCR excerpt:
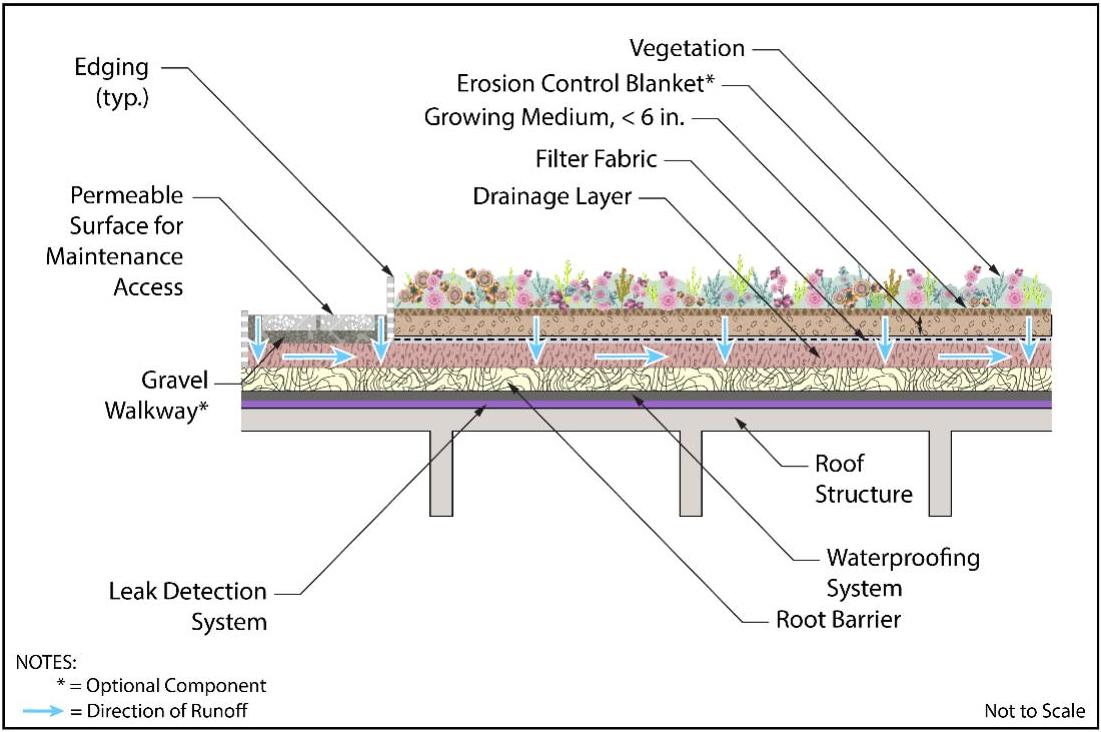
ofs and typically limits the variety of vegetation that may be selected. When designing an extensive green roof, it is crucial that the growing medium depth be sufficient to support the selected vegetation.

[OCR image]

The following growing media design criteria apply only to extensive green roofs:

- The tested maximum media water retention, when using the ASTM E2399 method, or the maximum water capacity, when using the FLL method, must be at least 35% by volume but no greater than 65%, also by volume.
- The organic content must be less than 4.06 pounds per cubic foot or 65 grams per liter.
PDF page 10, image 1
Mistral ID: img-10.jpeg. Extraction bundle(s): 2026_BMP_9_4_Green_Roofs. Original page | Image file
Surrounding OCR excerpt:
ior to selection of this type of green roof, the structural integrity of the building and access to water must be analyzed. The illustration below depicts a cross-sectional view of an intensive green roof.

[OCR image]

The following growing media design criteria apply only to intensive green roofs:

- The tested maximum media water retention, when using the ASTM E2399 method, or the maximum water capacity, when using the $FLL$ method, must be at least $45\%$ by volume but no greater than $65\%$, also by volume.
- The organic content must be less than 5.62 pounds per cubic foot or 90 grams per liter.

Note that the m
PDF page 11, image 1
Mistral ID: img-11.jpeg. Extraction bundle(s): 2026_BMP_9_4_Green_Roofs. Original page | Image file
Surrounding OCR excerpt:
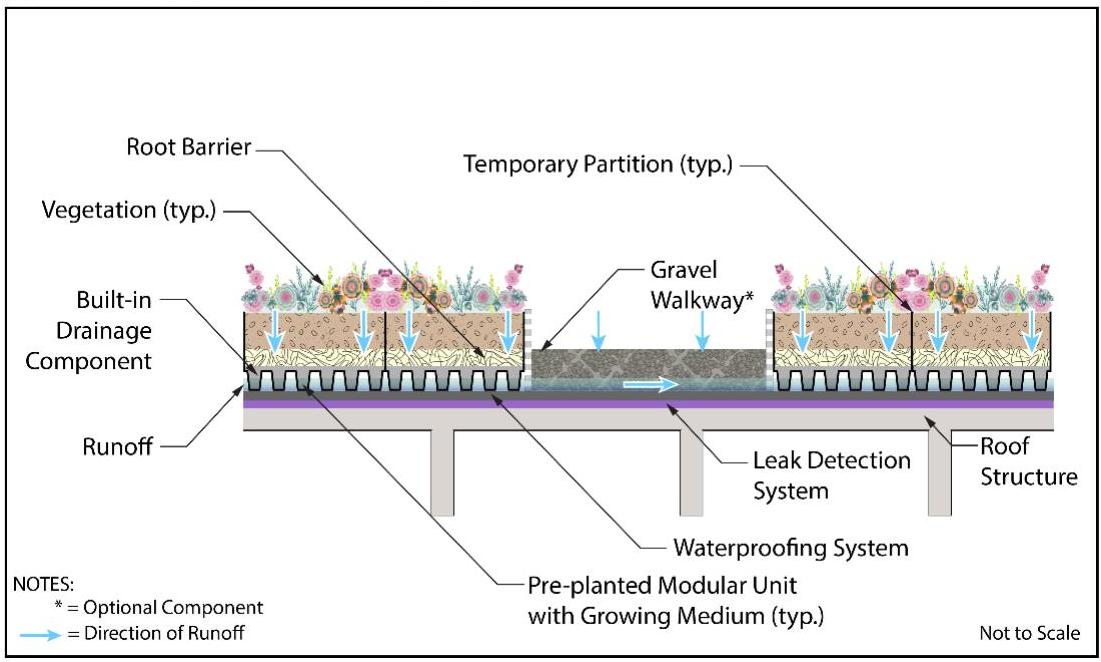
ow depicts a cross-sectional view of a modular green roof. The gravel walkway between units is optional. The temporary partitions serve to keep the contents of an individual module intact during placement.

[OCR image]
PDF page 12, image 1
Mistral ID: img-12.jpeg. Extraction bundle(s): 2026_BMP_9_4_Green_Roofs. Original page | Image file
Surrounding OCR excerpt:
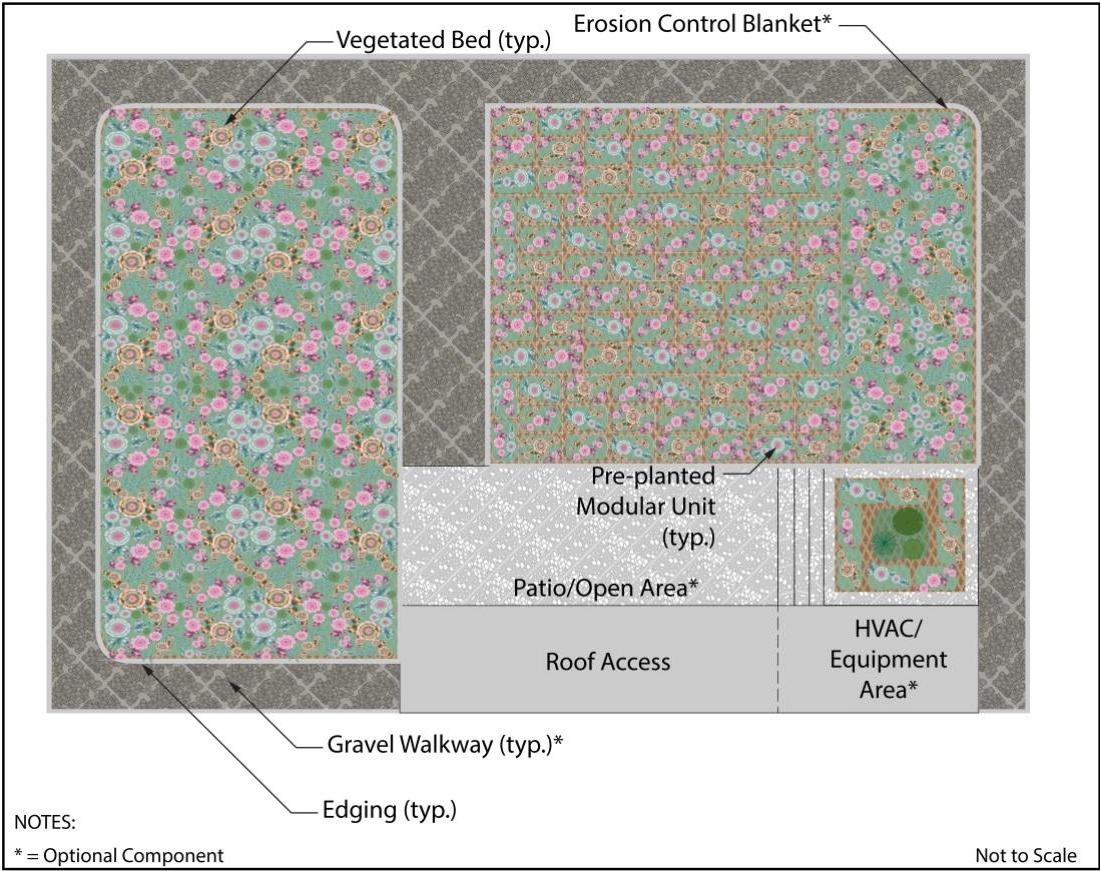
t is only a suggested approach and is not meant to limit the design in any way. Access walkways are shown, along with an open area and a stepped planter box which serves as a wind screen for the open area.

[OCR image]
PDF page 15, image 1
Mistral ID: img-13.jpeg. Extraction bundle(s): 2026_BMP_9_4_Green_Roofs. Original page | Image file
Surrounding OCR excerpt:
[OCR image]
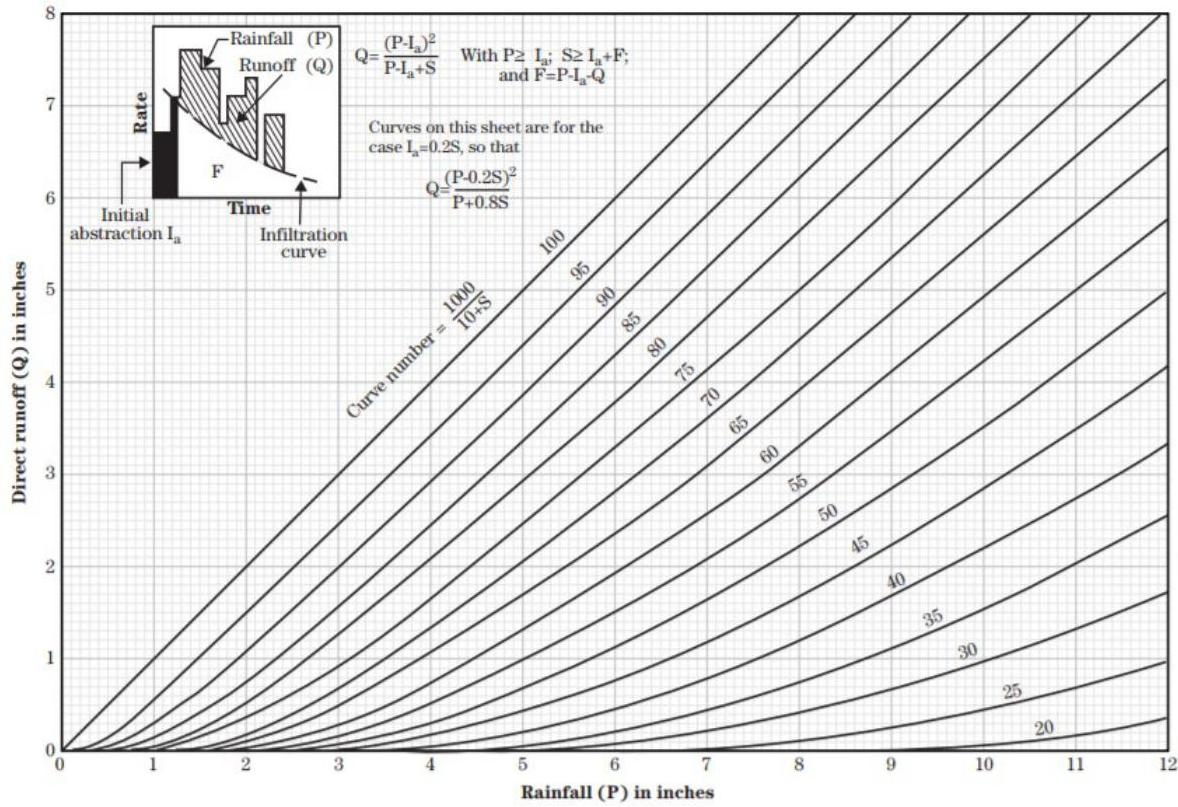
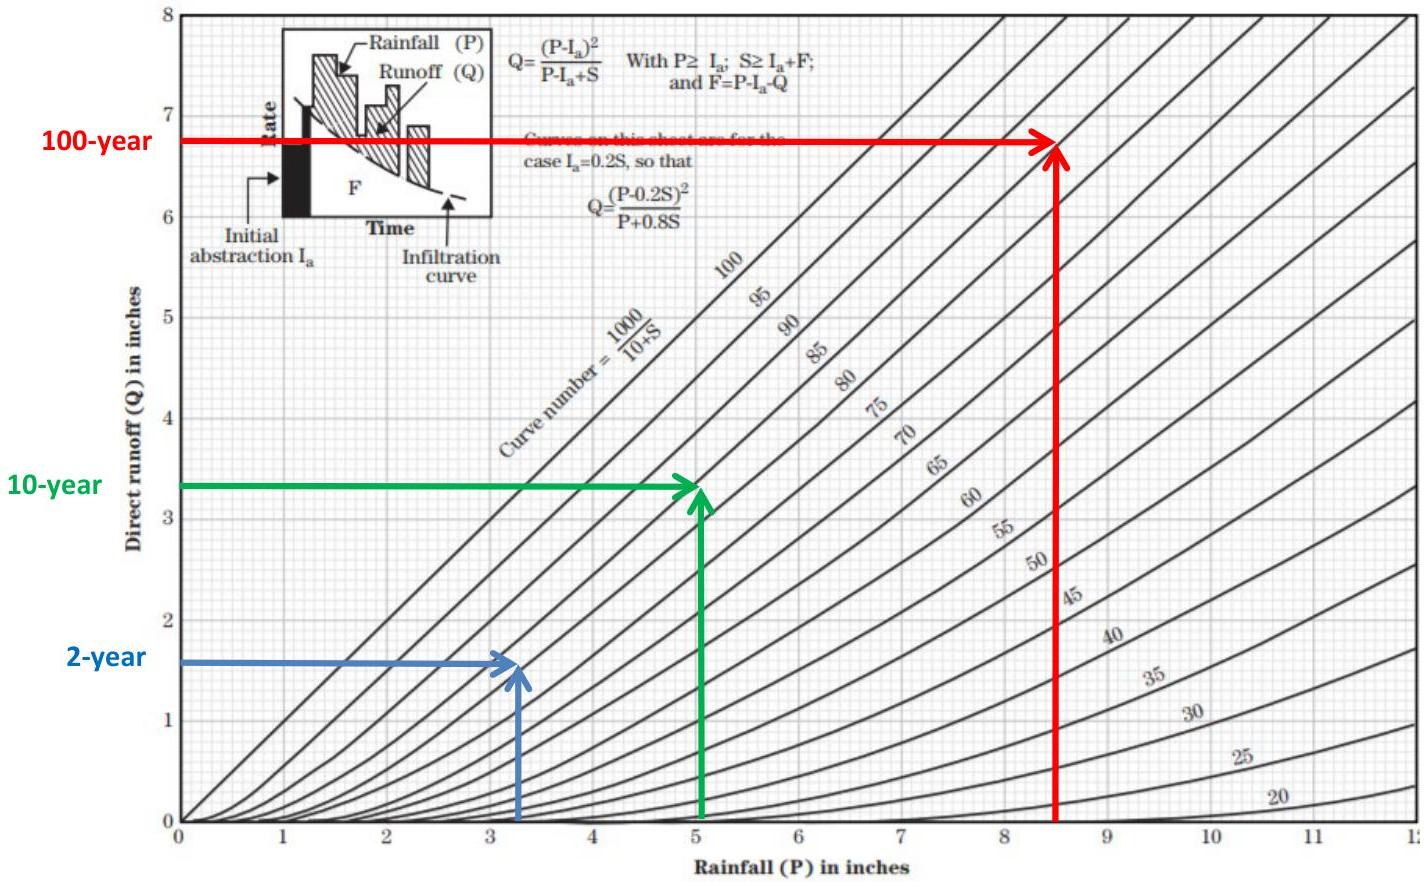
Figure 10-2 ES-1001 graphical solution of the equation  $Q = \frac{(P - 0.2S)^2}{P + 0.8S}$

# Step 5: Calculate Peak Flow Rates by Adjusted Curve Number

Calculate the time of concentration and use it along with the adjusted curve numbers determined in Step 4 to calculate the peak flow rates of each of the storm events using NRCS methodology.

Note that the time of concentration of a green roof must b
PDF page 18, image 1
Mistral ID: img-14.jpeg. Extraction bundle(s): 2026_BMP_9_4_Green_Roofs. Original page | Image file
Tables on the same PDF page: Table 6
Surrounding OCR excerpt:
ber can be found using the rainfall depths and the stormwater runoff depths calculated in Step 3 for each storm, as depicted below, in blue, green and red for the 2-, 10- and 100-year storms, respectively.

[OCR image]
Figure 10-2 ES-1001 graphical solution of the equation  $Q = \frac{(P - 0.2S)^2}{P + 0.8S}$

From the figure above, the adjusted curve numbers for the 2-, 10- and 100-year storm events are approximately 81, 84 and 85, respectively. For the WQDS, there is no runoff, so the curve number should be 61, which produces no runoff in the WQDS.

|  Storm Event | Rainfall Depth (in) | Direct Runoff Depth (in) |