Extracted images: Wet Ponds (Large-Scale GI)
Printed revision: January 2026.
Back to source | Original PDF | Image metadata
Original Mistral crops are preserved byte for byte. A crop can be a figure, table, equation, or other visual; no visual content is inferred as a numerical rule. Record and table associations use the same PDF page unless a direct image placeholder is identified. Nearby OCR excerpts are context, not verified captions.
PDF page 1, image 1
Mistral ID: img-0.jpeg. Extraction bundle(s): 2026_BMP_10_5_Wet_Ponds. Original page | Image file
Tables on the same PDF page: Table 1
Surrounding OCR excerpt:
# 10.5 WET PONDS (GI)

[OCR image]

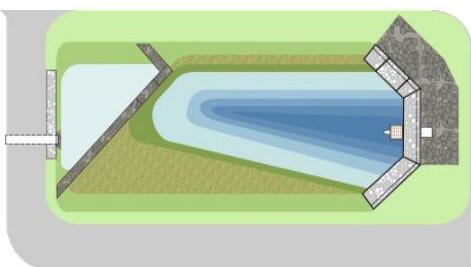
Wet ponds designed with a reuse component and a native vegetation perimeter are used to address the stormwater runoff quantity impacts of land development. This type of stormwater facility has an elevated outlet structure that creates a permanent pool where stormwater runoff is detained and attenuated. Wet ponds can be designed as multi-stage, multi-function systems; extended detention in the permanent
PDF page 2, image 1
Mistral ID: img-1.jpeg. Extraction bundle(s): 2026_BMP_10_5_Wet_Ponds. Original page | Image file

Surrounding OCR excerpt:
nts of N.J.A.C. 7:8-5.3 is obtained.

GI wet ponds must have a maintenance plan and must be reflected in a deed notice recorded in the county clerk's office to prevent alteration or removal.

# Applications

[OCR image]

Pursuant to N.J.A.C. 7:8-5.2(a)(2), the minimum design and performance standards for groundwater recharge, stormwater runoff quality and stormwater runoff quantity at N.J.A.C. 7:8- 5.4, 5.5 and 5.6 shall be met by incorporating green infrastructure in accordance with N.J.A.C. 7:8-5.3. Pursuant to N.J.A.C. 7:8-5.3(c), large-scale green infrastructure BMPs may only be used to satisfy the stormwater runof
PDF page 2, image 2
Mistral ID: img-2.jpeg. Extraction bundle(s): 2026_BMP_10_5_Wet_Ponds. Original page | Image file

Surrounding OCR excerpt:
.J.A.C. 7:8-1.2, the design must also include the specified vegetated perimeter and provide beneficial reuse of the stormwater runoff captured, both of which are discussed under the Design Criteria section.

[OCR image]

GI wet ponds may be designed to reduce peak runoff rates when designed as an on-line system which provides storage volume to accommodate runoff from larger design storms. Regardless of the design storm chosen, wet ponds must be designed for stability in accordance with the Standards for Soil Erosion and Sediment Control in New Jersey, as required by N.J.A.C. 7:8.
PDF page 7, image 1
Mistral ID: img-3.jpeg. Extraction bundle(s): 2026_BMP_10_5_Wet_Ponds. Original page | Image file
Surrounding OCR excerpt:
[OCR image]

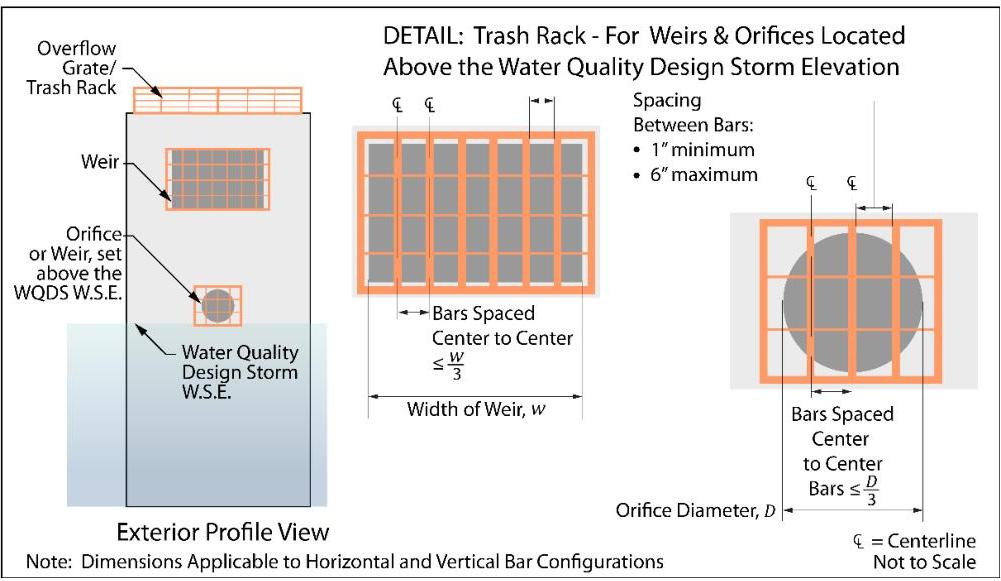
- An overflow grate is designed to prevent obstruction of the overflow structure. If an outlet structure has an overflow grate, the grate must comply with the following requirements:

The overflow grate must be secured to the outlet structure but removable for emergencies and maintenance;
The overflow grate spacing must be no greater than 2 inches across the smallest dimension; and
The overflow grate m
PDF page 7, image 2
Mistral ID: img-4.jpeg. Extraction bundle(s): 2026_BMP_10_5_Wet_Ponds. Original page | Image file
Surrounding OCR excerpt:
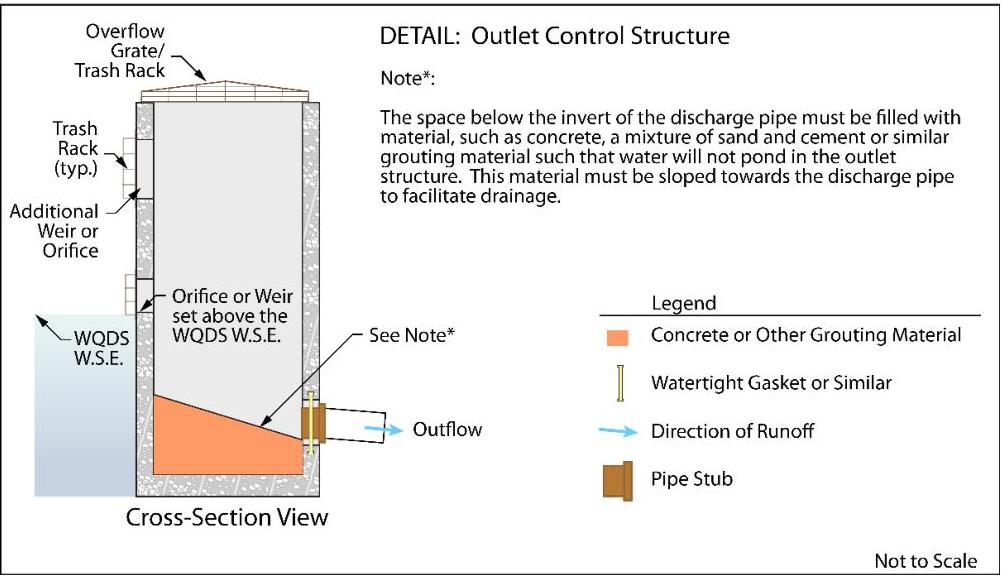
and cement, or similar grouting material, such that water will not pond in the outlet structure. This material must be sloped towards the discharge pipe to facilitate drainage, as shown in the detail below.

[OCR image]
PDF page 9, image 1
Mistral ID: img-5.jpeg. Extraction bundle(s): 2026_BMP_10_5_Wet_Ponds. Original page | Image file
Surrounding OCR excerpt:
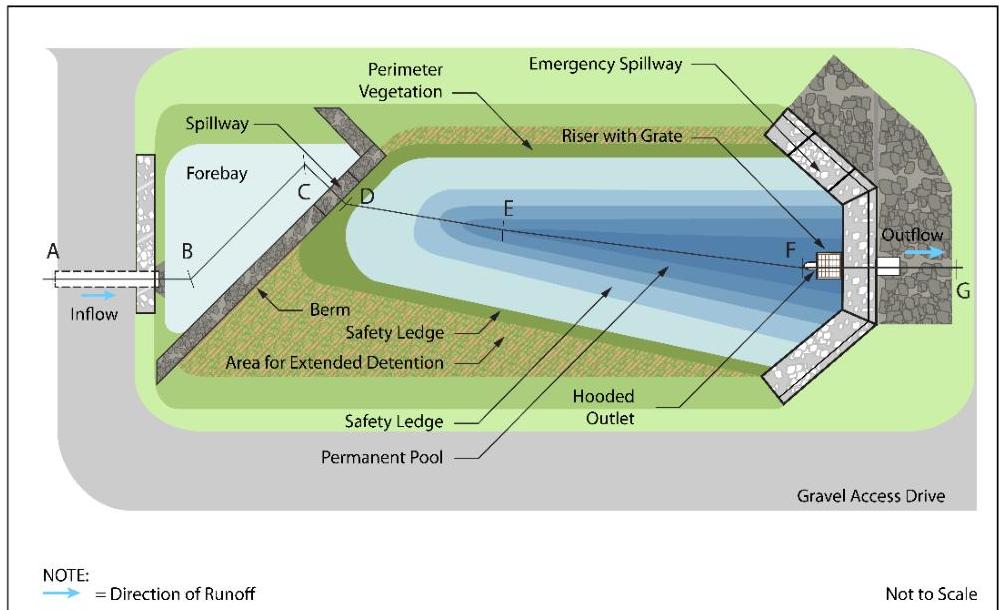
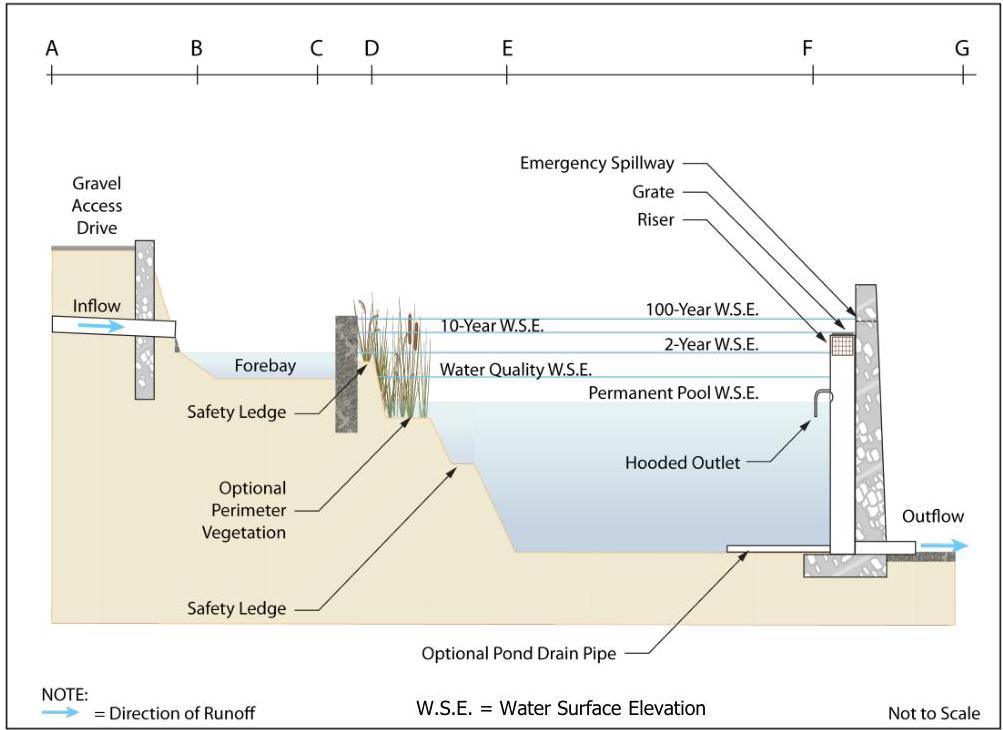
plan and profile view. The lettered path shown in the plan view represents the alignment along which an imaginary slice was made to prepare the corresponding profile view. The re-use component is not shown.

[OCR image]
GI Wet Pond - Plan View
PDF page 10, image 1
Mistral ID: img-6.jpeg. Extraction bundle(s): 2026_BMP_10_5_Wet_Ponds. Original page | Image file
Surrounding OCR excerpt:
[OCR image]
GI Wet Pond - Profile View

# TSS Removal Rates for GI Wet Ponds

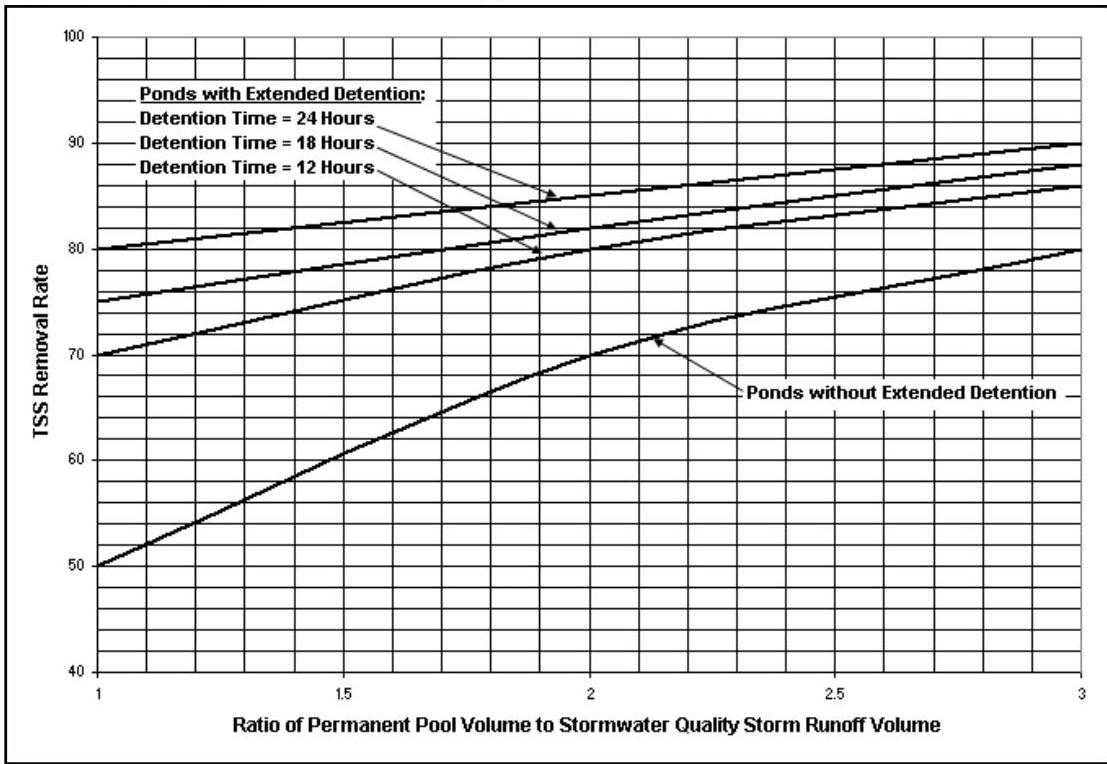
GI wet ponds may receive credit for pollutant removal only if a waiver or variance form the green infrastructure requirements of N.J.A.C. 7:8-5.3 is obtained. GI wet ponds must be designed to treat the volume generated by the WQDS to merit the approved TSS removal rate specified in Table 5-3 at N.J.A.C. 7:8-5.2(f). Techniques to compute t
PDF page 11, image 1
Mistral ID: img-7.jpeg. Extraction bundle(s): 2026_BMP_10_5_Wet_Ponds. Original page | Image file
Tables on the same PDF page: Table 2 | Table 3
Surrounding OCR excerpt:
[OCR image]
TSS Removal Rates for GI Wet Ponds

The following example illustrates how to use the chart to determine the TSS removal rate provided:

Example: A number of GI wet pond designs are to be evaluated for TSS removal rates.

|  Design Number | Permanent Pool Volume (ac-ft) | WQ Runoff Volume | Extended Detention Period |   |   | Ratio of Permanent Pool to WQ Runoff | % TSS Removal  |
| --- | --- | --- | ---
PDF page 12, image 1
Mistral ID: img-8.jpeg. Extraction bundle(s): 2026_BMP_10_5_Wet_Ponds. Original page | Image file
Surrounding OCR excerpt:
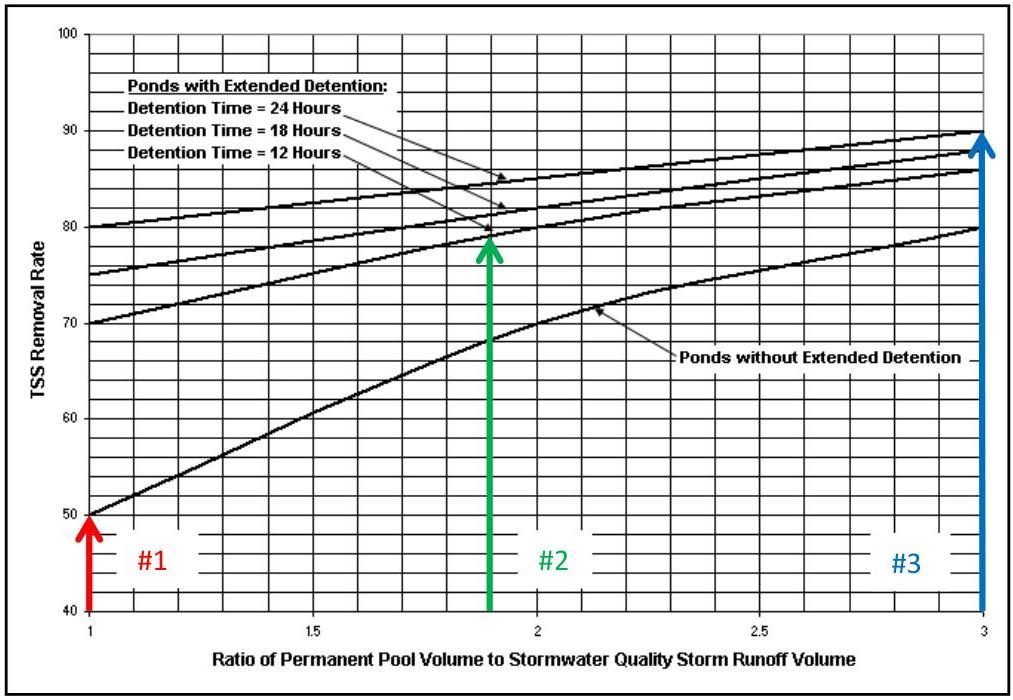
ides. Design #1 provides no extended detention; therefore, the lowest curve is used to determine the TSS removal rate. Designs #2 and 3 provide extended detention and therefore, use the upper set of curves.

[OCR image]

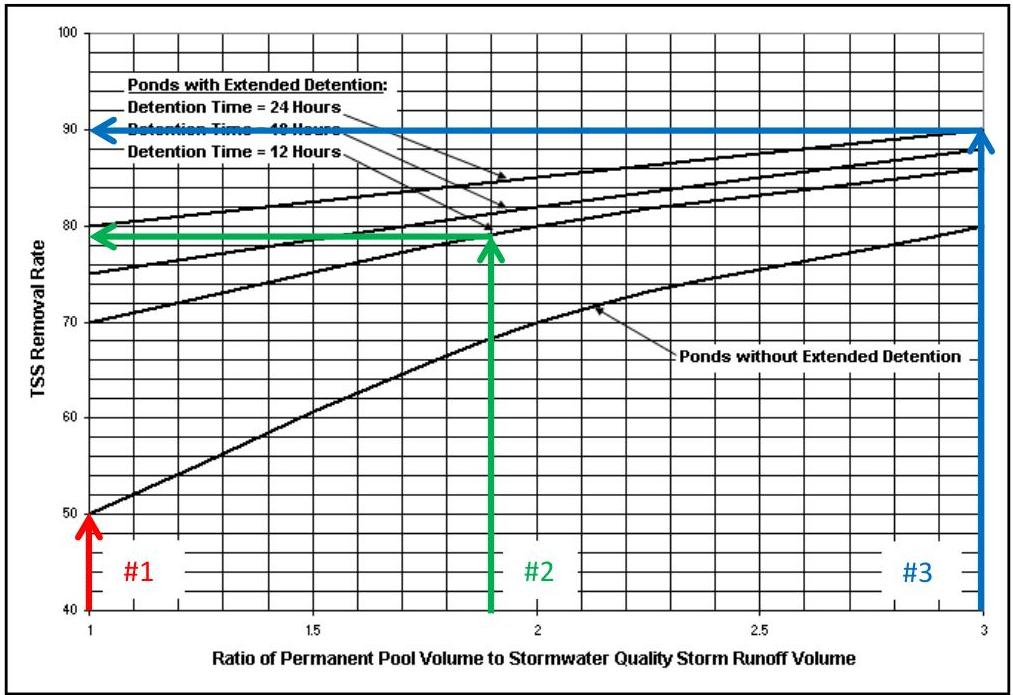
Step 3: For each of the designs, at the intersection of the vertical line from Step 2 with the respective curve, draw a horizontal line from right to left over to the y-axis to get the TSS removal rate.

[OCR image]

The resulting percent TSS Removal Rates appear in the last column of this table.
PDF page 12, image 2
Mistral ID: img-9.jpeg. Extraction bundle(s): 2026_BMP_10_5_Wet_Ponds. Original page | Image file
Surrounding OCR excerpt:
g)

Step 3: For each of the designs, at the intersection of the vertical line from Step 2 with the respective curve, draw a horizontal line from right to left over to the y-axis to get the TSS removal rate.

[OCR image]

The resulting percent TSS Removal Rates appear in the last column of this table.