Extracted images: Appendix C: Sample Municipal Stormwater Management Plan
Printed revision: January 2026.
Back to source | Original PDF | Image metadata
Original Mistral crops are preserved byte for byte. A crop can be a figure, table, equation, or other visual; no visual content is inferred as a numerical rule. Record and table associations use the same PDF page unless a direct image placeholder is identified. Nearby OCR excerpts are context, not verified captions.
PDF page 6, image 1
Mistral ID: img-0.jpeg. Extraction bundle(s): njswbmp-appendix-c-model-swmp-january-2026_OCR. Original page | Image file
Surrounding OCR excerpt:
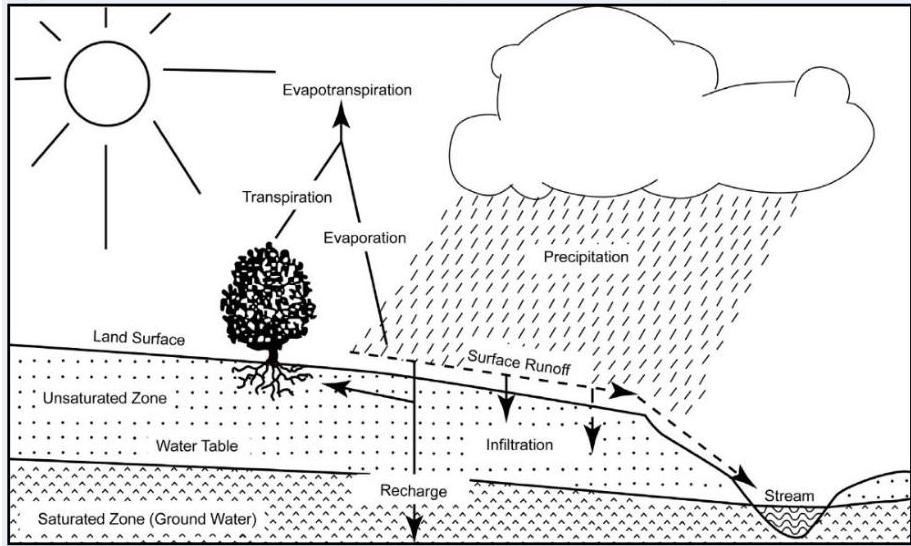
Figure C – 1: Groundwater Recharge in the Hydrologic Cycle
[OCR image]
Source: New Jersey Geological Survey Report GSR-32

In addition to increases in runoff peaks and volumes and loss of groundwater recharge, land development often results in the accumulation of pollutants on the land surface that runoff can mobilize and transport to streams. New impervious surfaces and cleared areas created by development can accumulate a variety of pollutants from the atmosphere, includ
PDF page 7, image 1
Mistral ID: img-1.jpeg. Extraction bundle(s): njswbmp-appendix-c-model-swmp-january-2026_OCR. Original page | Image file
Surrounding OCR excerpt:
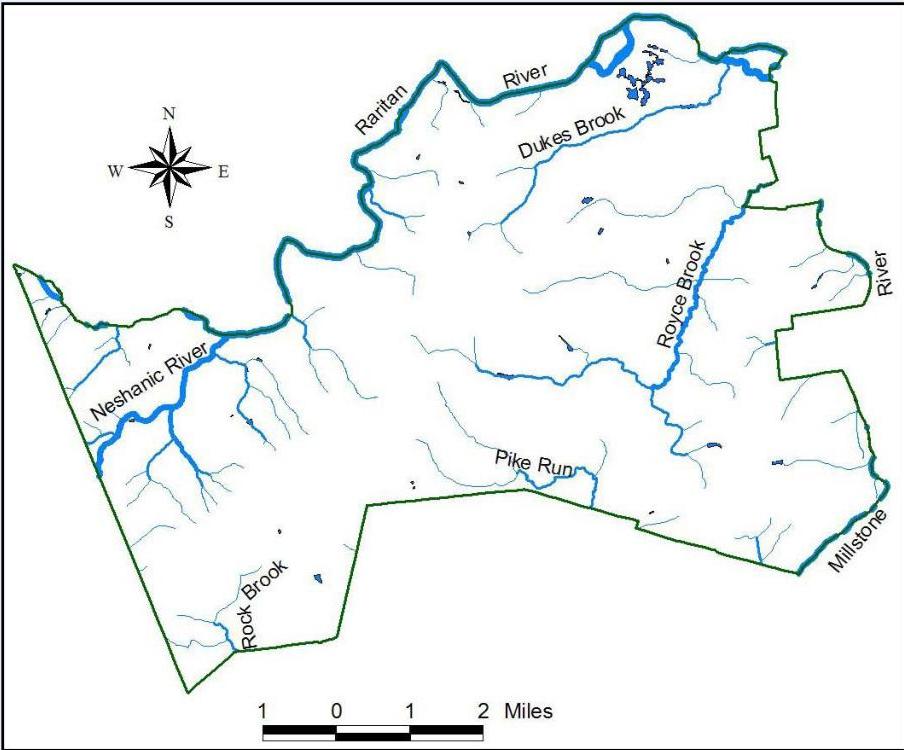
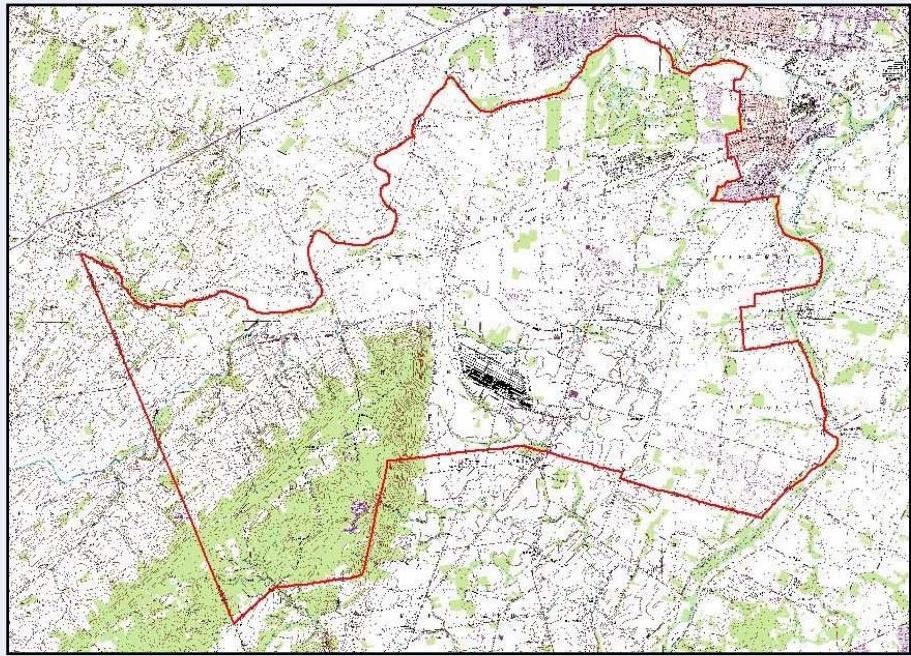
es and pollutant loads to the waterways of the municipality. Figure C - 2 illustrates the waterways in {insert name of municipality}. Figure C - 3 depicts the municipal boundary on the USGS quadrangle maps.

[OCR image]
Figure C - 2: The Waterways of {insert name of municipality}
PDF page 8, image 1
Mistral ID: img-2.jpeg. Extraction bundle(s): njswbmp-appendix-c-model-swmp-january-2026_OCR. Original page | Image file
Surrounding OCR excerpt:
[OCR image]
Figure C - 3: {insert name of municipality} Boundary on USGS Quadrangles

# Population Statistics

It is recommended that the MSWMP include a discussion about the population statistics. Population statistics are available online from the New Jersey Department of Labor at: https://www.njlm.org/384/2020-Census-Information.

# Mapping Requirements

Mapping, using Geographic Information System (GIS) softwar
PDF page 25, image 1
Mistral ID: img-3.jpeg. Extraction bundle(s): njswbmp-appendix-c-model-swmp-january-2026_OCR. Original page | Image file
Surrounding OCR excerpt:
e strategies. To access the toolkit, start by navigating to the toolbar and select the Toolkit, which can be directly accessed at:

https://experience.arcgis.com/experience/9daab51c2f5542969d50437522e012c4.

[OCR image]

In addition to redirecting the user to a designated page corresponding to the topic identified in the tab title, each of the tabs contains pull-down menus. It is recommended the user start with the overview tab. By working through the tabs, from left to right, the municipality can develop the climate resilience
PDF page 30, image 1
Mistral ID: img-4.jpeg. Extraction bundle(s): njswbmp-appendix-c-model-swmp-january-2026_OCR. Original page | Image file
Surrounding OCR excerpt:
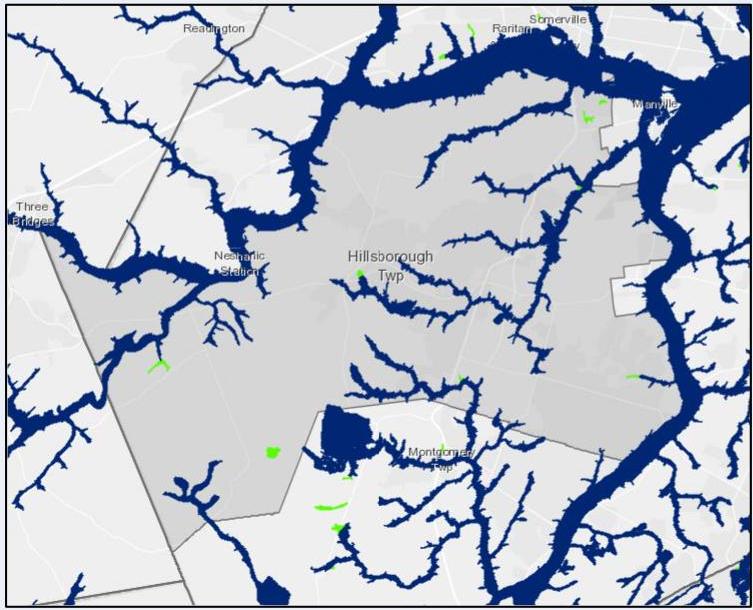
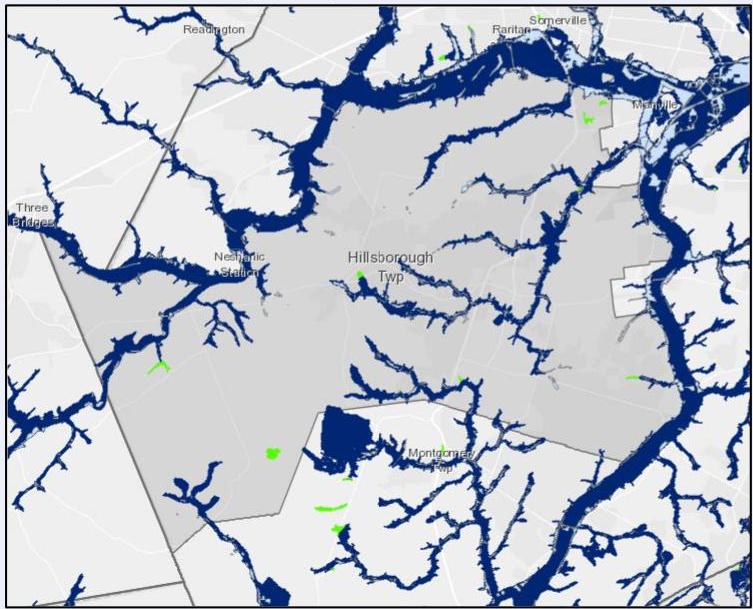
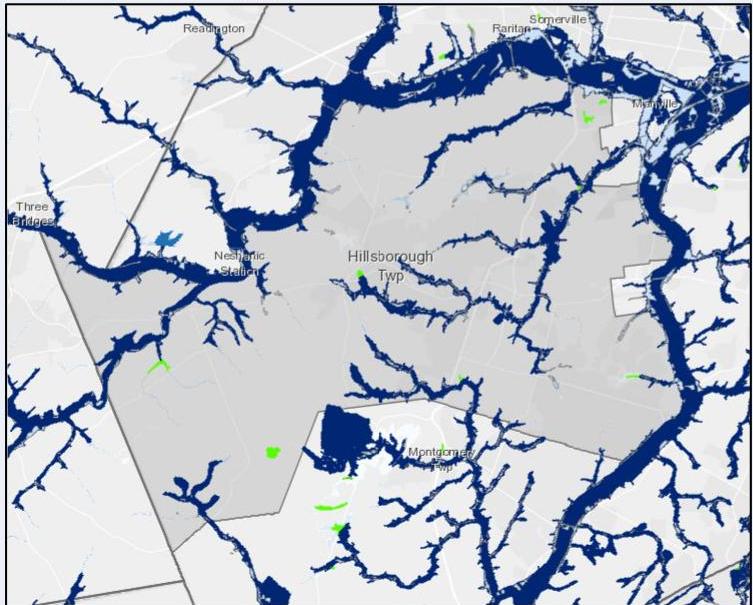
aps summarize the progressive increase in flooding due to climate change impacts that will affect {insert name of municipality}. These are the impacts and areas that will need to be mitigated and monitored.

[OCR image]
Figure 1: Township of Hillsborough, NJ with NJ Inland Design Flood Elevation
PDF page 31, image 1
Mistral ID: img-5.jpeg. Extraction bundle(s): njswbmp-appendix-c-model-swmp-january-2026_OCR. Original page | Image file
Surrounding OCR excerpt:
[OCR image]
Figure 2: Township of Hillsborough, NJ plus LULC Urban 2015 with Future Flooding

[OCR image]
Figure 3: Township of Hillsborough, NJ plus HAND Average Flood Event

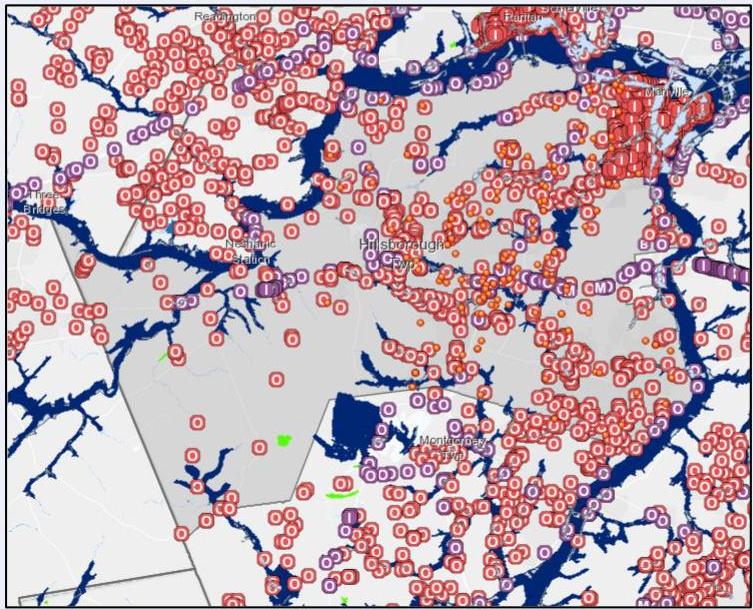
Similar to the climate change impacts, the stormwater management facilities within {insert name of municipality} were identified using the NJ-WET Tool and NJ GeoWeb application. These layers are not exhaustive and the location o
PDF page 31, image 2
Mistral ID: img-6.jpeg. Extraction bundle(s): njswbmp-appendix-c-model-swmp-january-2026_OCR. Original page | Image file
Surrounding OCR excerpt:
[OCR image]
Figure 2: Township of Hillsborough, NJ plus LULC Urban 2015 with Future Flooding

[OCR image]
Figure 3: Township of Hillsborough, NJ plus HAND Average Flood Event

Similar to the climate change impacts, the stormwater management facilities within {insert name of municipality} were identified using the NJ-WET Tool and NJ GeoWeb application. These layers are not exhaustive and the location of some of these layers are at the center of the project site, aerial imagery, site visits, local documents a
PDF page 32, image 1
Mistral ID: img-7.jpeg. Extraction bundle(s): njswbmp-appendix-c-model-swmp-january-2026_OCR. Original page | Image file
Tables on the same PDF page: Table 3
Surrounding OCR excerpt:
[OCR image]
Figure 4: Climate Change Impacts Overlapped with Stormwater Management Facilities

Figure 5: Vulnerability Assessment Matrix

|  Asset Name | Asset Category | Climate Impact |   |   |   |   |   | Description of Impacts  |
| --- | --- | --- | --- | --- | --- | --- | --- | --- |
|   |   |  Increased Temp. | Sea level rise | Precipitation | Ocean Acidification | Drought/Water Supply |   |   |
|  Outfall 10
PDF page 36, image 1
Mistral ID: img-8.jpeg. Extraction bundle(s): njswbmp-appendix-c-model-swmp-january-2026_OCR. Original page | Image file
Surrounding OCR excerpt:
[OCR image]
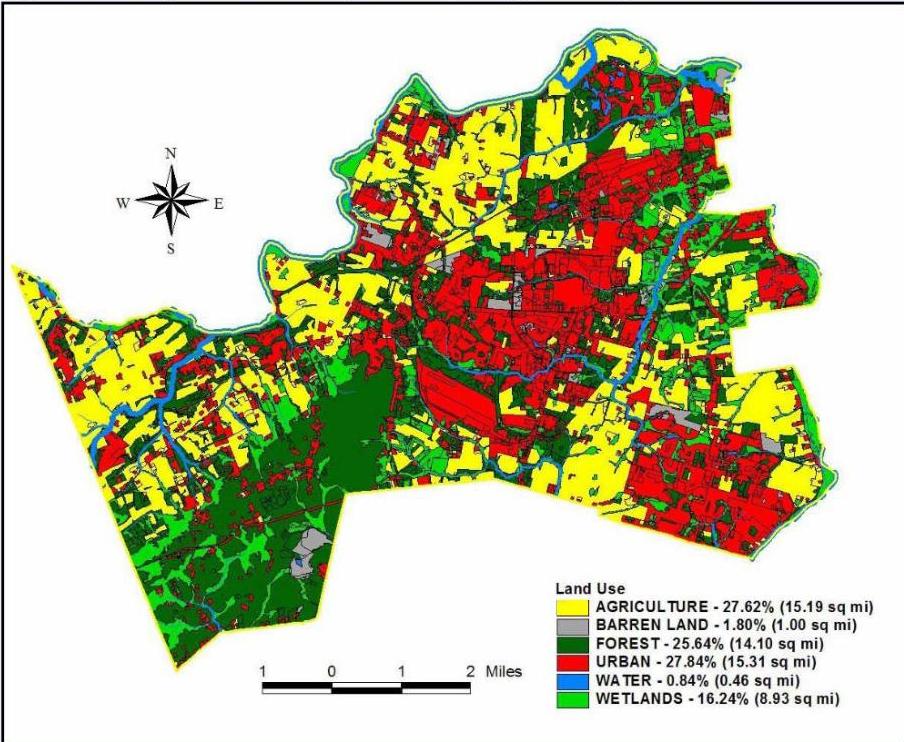
Figure C - 6: {insert name of municipality} Existing Land Use

[OCR image]
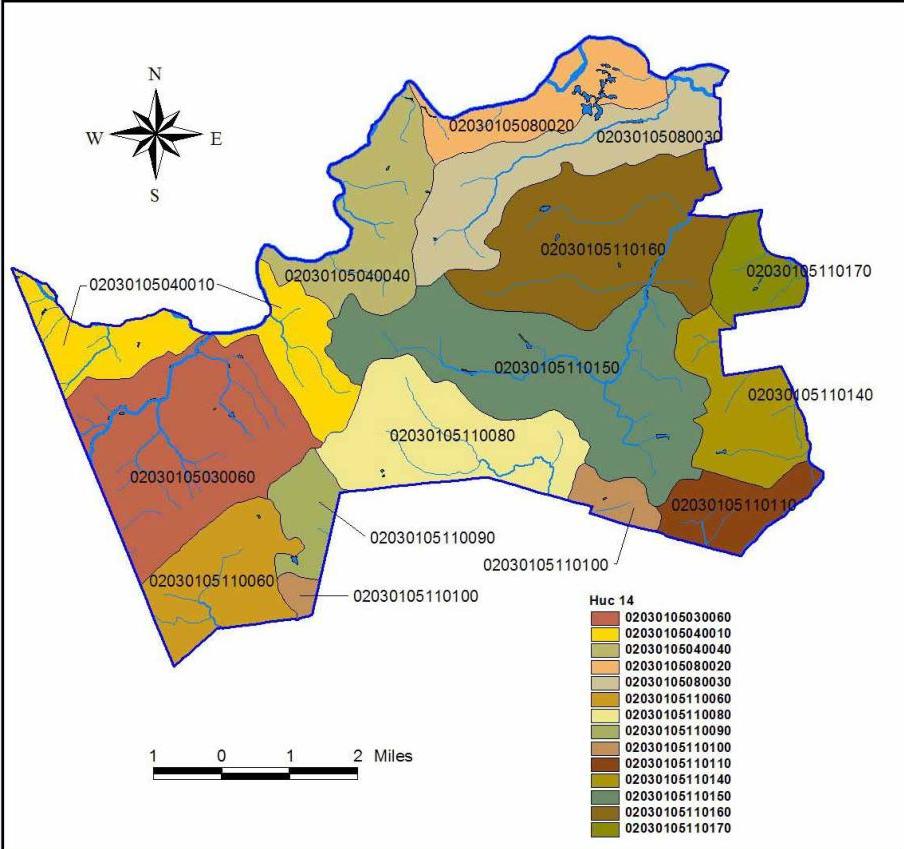
Figure C - 7: Hydrologic Units (HUC14s) within {insert name of municipality}
PDF page 36, image 2
Mistral ID: img-9.jpeg. Extraction bundle(s): njswbmp-appendix-c-model-swmp-january-2026_OCR. Original page | Image file
Surrounding OCR excerpt:
[OCR image]
Figure C - 6: {insert name of municipality} Existing Land Use

[OCR image]
Figure C - 7: Hydrologic Units (HUC14s) within {insert name of municipality}
PDF page 37, image 1
Mistral ID: img-10.jpeg. Extraction bundle(s): njswbmp-appendix-c-model-swmp-january-2026_OCR. Original page | Image file
Surrounding OCR excerpt:
[OCR image]
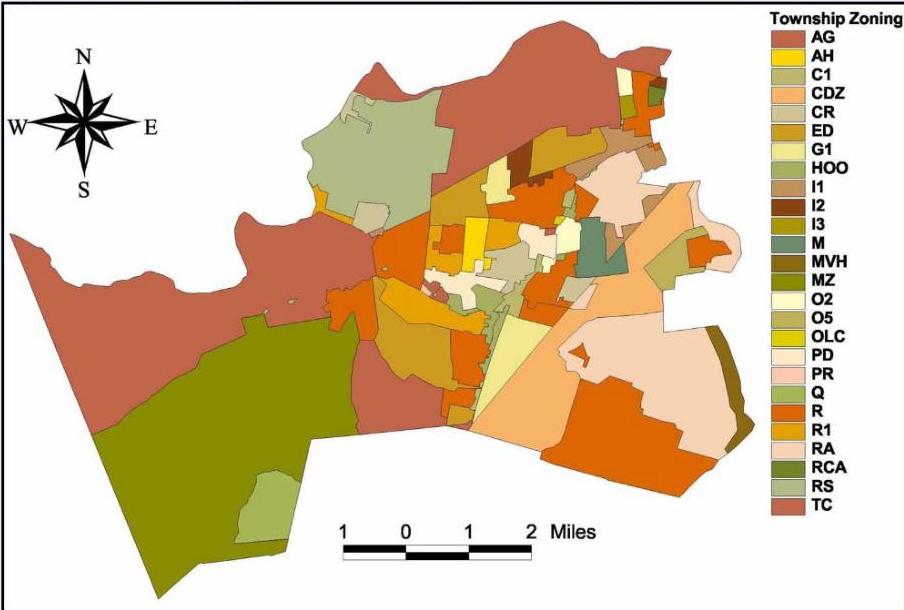
Figure C - 8: Zoning Districts within {insert name of municipality}

[OCR image]
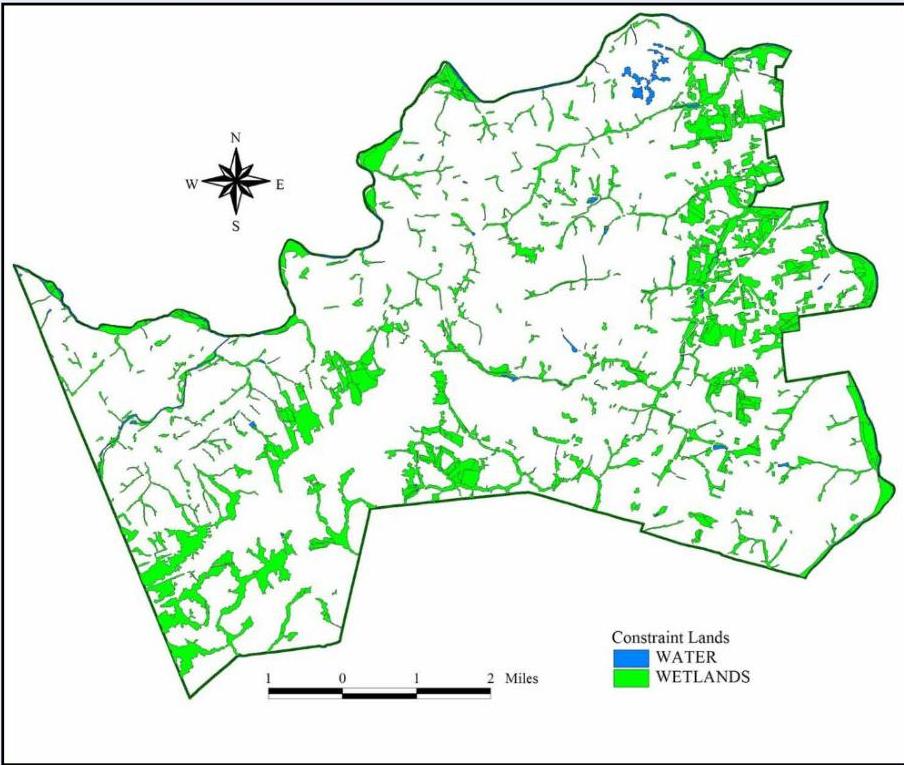
Figure C - 9: Wetlands and Water Land Uses within {insert name of municipality} - Constrained Land
PDF page 37, image 2
Mistral ID: img-11.jpeg. Extraction bundle(s): njswbmp-appendix-c-model-swmp-january-2026_OCR. Original page | Image file
Surrounding OCR excerpt:
[OCR image]
Figure C - 8: Zoning Districts within {insert name of municipality}

[OCR image]
Figure C - 9: Wetlands and Water Land Uses within {insert name of municipality} - Constrained Land